Table of Contents
Home
/
Blog
/
Profitability of projects: how to set up financial management in the construction business
1.2k
9 min
10.04.2025
Profitability of projects: how to set up financial management in the construction business
Sergiy Shuldik
Financial Expert at Finmap
Finance doesn’t forgive assumptions. If you’re keeping records with a “I’ll write it down later in my notebook” or “I’ll just remember it” approach, get ready for financial chaos.
One account, multiple directions and clients — and suddenly you no longer understand what’s bringing in profit and what’s just draining resources.
How can you detect in time that one direction is consuming all your profits? Without a clear management system, you risk not noticing how the money is simply disappearing and the business is heading toward financial disaster. Let’s figure out how to spot the problem early and take control of your finances before it’s too late.
Multiple Directions — One Answer: Calculate Profitability
If you have several business directions, you’re no longer just an entrepreneur — you’re the owner of a portfolio of mini-businesses. And each one has its own economy. The only question is whether you can see it.
To understand what’s truly working, you need to calculate the profitability of each direction separately.
Profitability isn’t just a percentage in a report. It’s an efficiency indicator that shows how productively a business uses its resources to generate profit.
The most important type is usually considered to be sales profitability, and the higher the figure — the better the company controls its expenses:
Profitability = (Profit / Revenue) × 100%
For example, if you earned $80,000 in revenue from a certain project, and the net profit from this direction was $20,000, then profitability is calculated as follows:
(20,000 / 80,000) × 100% = 25%
This means that each dollar earned brings in $0.25 in net profit.
.webp)
.webp)
.webp)
.webp)
If you understand profitability and know how to “read” it, the question “where to find money?” solves itself.
Because if one direction brings only 5% profitability, while another brings 28% — that’s a clear signal where to invest more time and resources, and what to stop before it’s too late.
When There’s a Business but No Money — the Problem Is Not the Market, It’s the Financial Management
Management by profit centers is not a whim, but a survival tool. If you don’t see profitability separately, it means you’re not managing the business — you’re just reacting to problems after they arise.
With this understanding, the owner of a construction company offering several types of services turned to Finmap.
The company is involved in construction, performs renovation work, and sells building materials. Each of these directions has its own clients, contracts, and payments.
However, there was no talk of financial order. The owner complained that in some months, his foremen were earning higher salaries than he could take out as dividends.
Sometimes at night I’d lie in bed and spend half the night trying to piece together the full picture in my head, to understand what I was doing wrong. Maybe someone else would have already shut everything down and gone back to doing regular renovations. But I couldn’t just give up! — Owner of a construction company
To move forward, it was necessary to optimize processes and clearly define key financial indicators. The company owner identified several mandatory points he wanted to track:
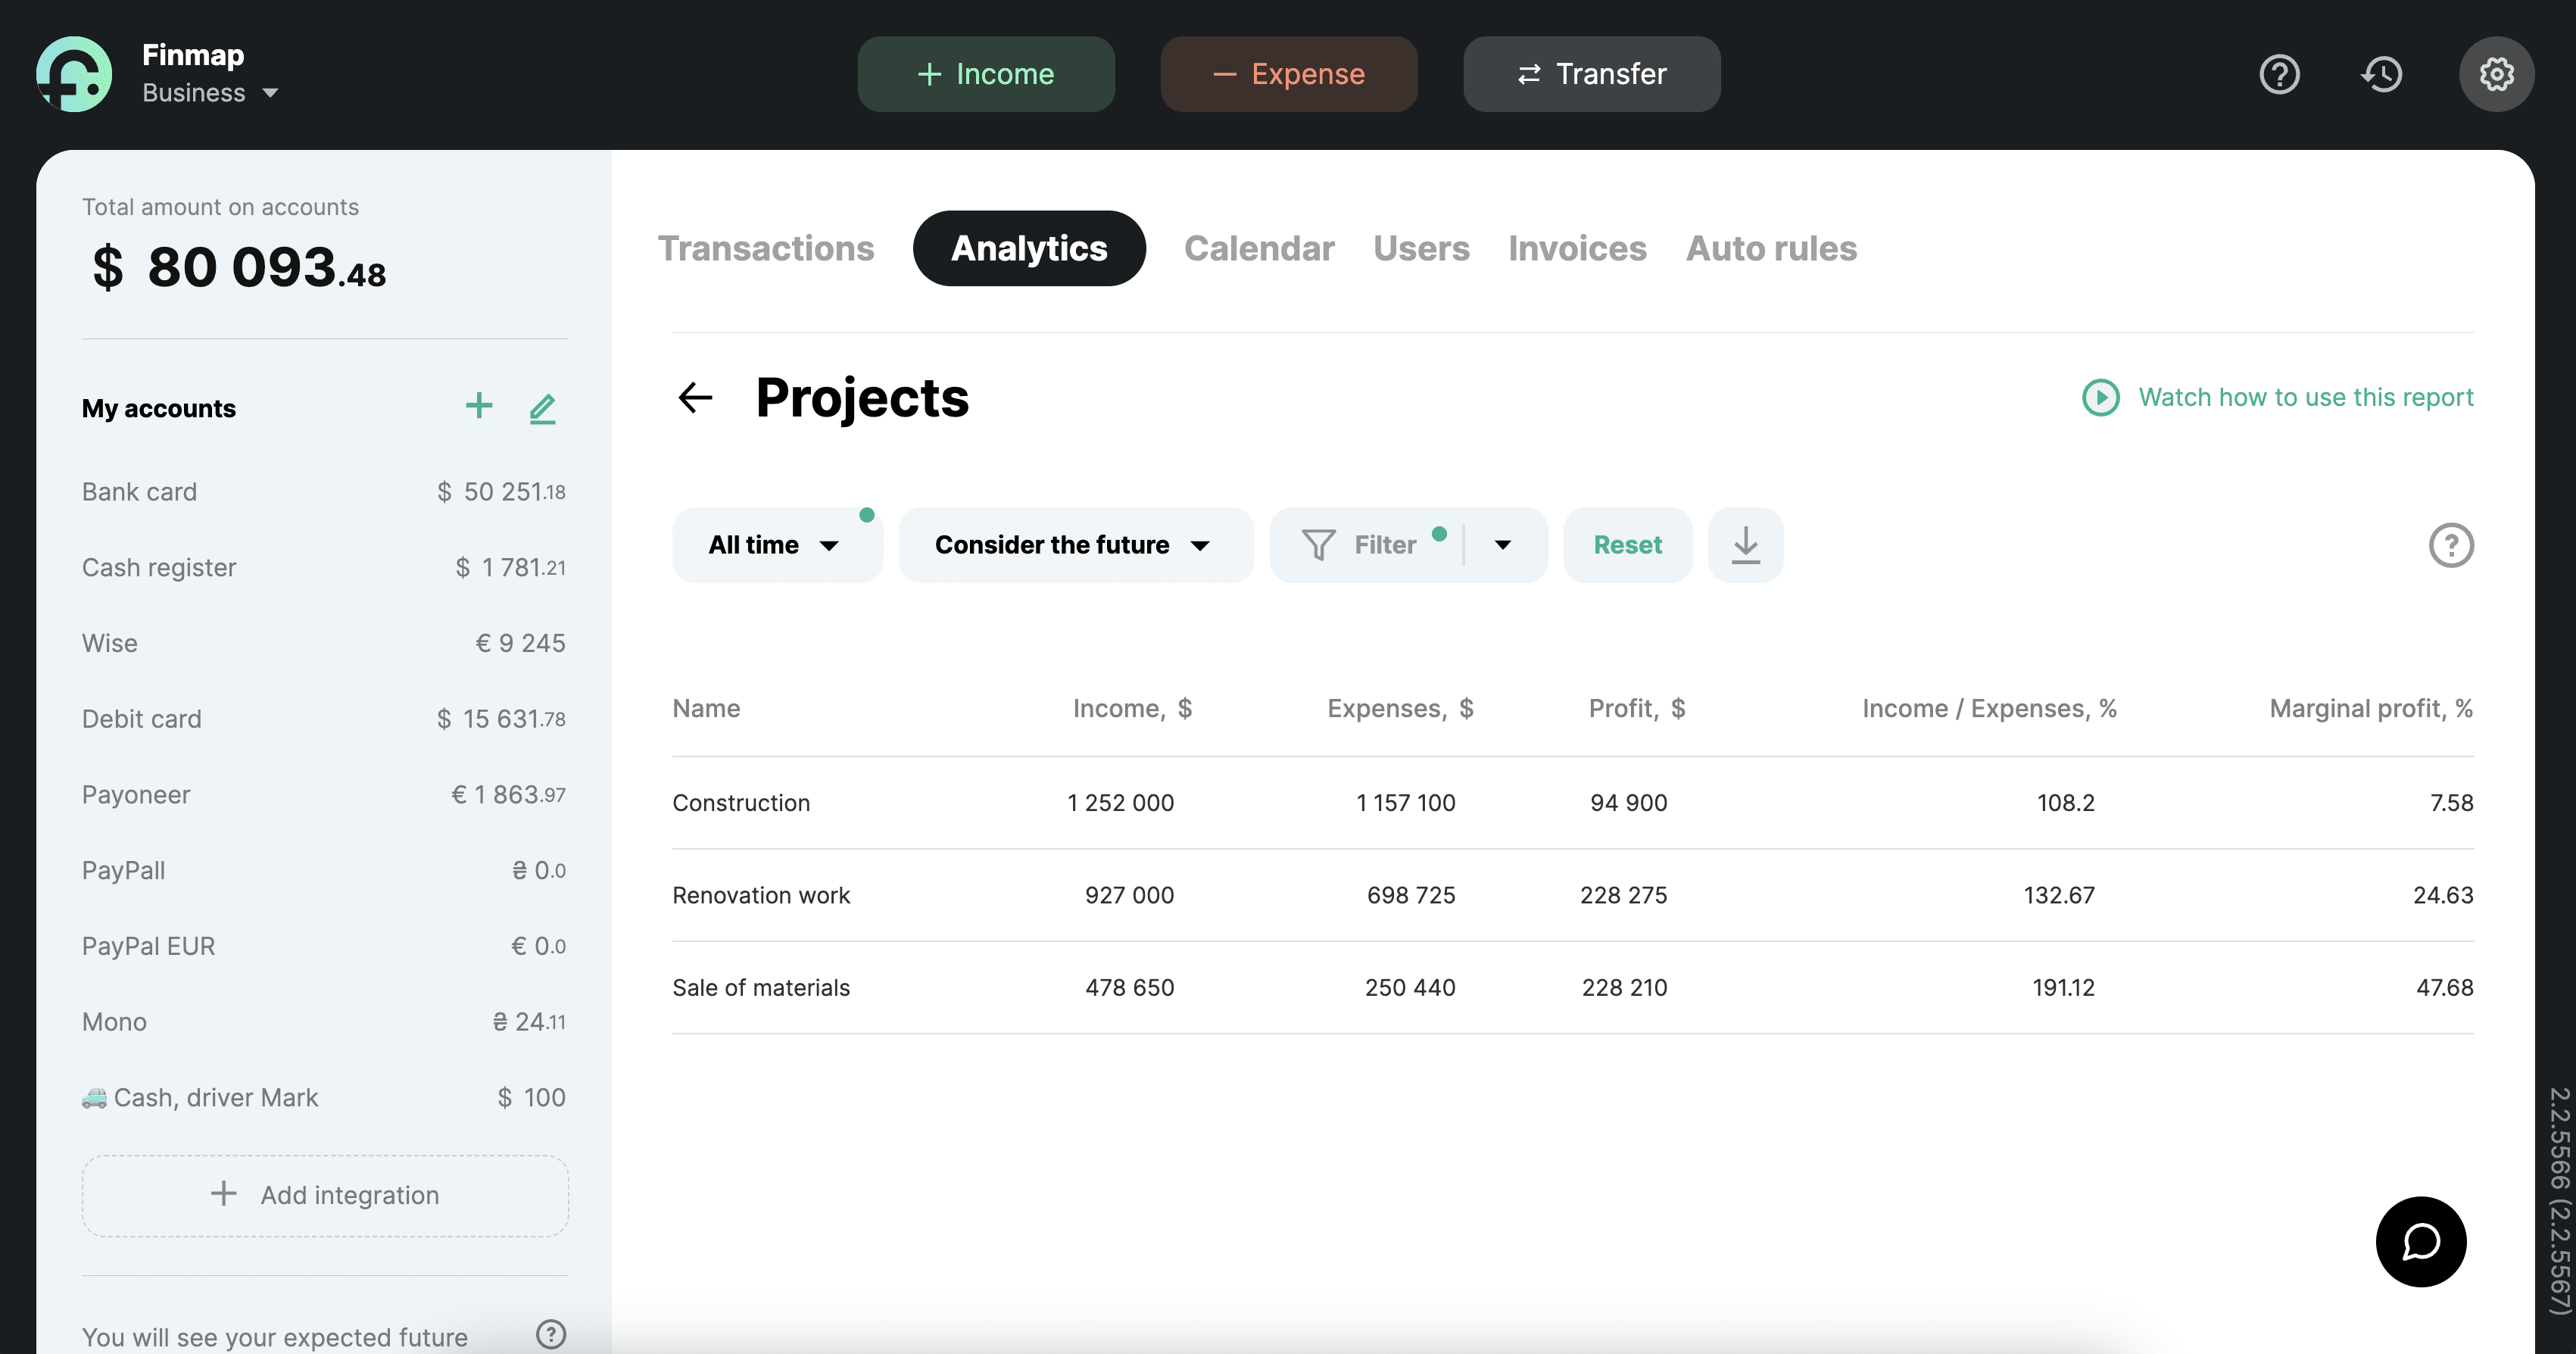
- Profit and profitability of each direction. It’s important to be able to open a report, for example, for “Construction,” and clearly understand the revenue, expenses, margin, and profitability of that direction. This helps assess whether it’s worth continuing to operate in that area.
- Results by each client and project. It’s essential to see which orders don’t bring profit and whether it’s necessary to adjust pricing for construction and renovation services to avoid loss-making contracts.
- Overall results for the entire company. The ability to determine how much profit can be directed to dividends and how much should be reinvested in business development.
- Optimization of petty cash processes. Foremen constantly handle cash, and tracking expenses that occur multiple times a day without a proper system is extremely difficult. It was necessary to implement a mechanism that allows easy control of these expenses and ensures transparency.
Due to lack of time for developing and creating complex Excel spreadsheets, Finmap’s automated solutions became the optimal choice for effective financial management.
How Finmap Helps Structure Finances and Make Strategic Decisions
The experience of the construction company proves that when a business develops in multiple directions, financial management without a system can easily turn into chaos. Below is a brief overview of key solutions that transformed internal financial management within the company.
Three Directions — Three Separate Financial Realities
Finmap’s financial management system includes a dedicated feature for separating business directions — Projects. This entity can be used to tag not only types of activity but also the cities or countries where the business operates, locations, sites, orders, etc.
The company divided its activity into three main directions:
- Construction
- Renovation work
- Sale of materials
Each payment was tagged with a project — manually or using auto-rules. After a few weeks, the system gathered a full picture — profit and automatically calculated profitability for each direction are now tracked in real time.
How to Ensure Full Analytics by Client
In addition to Projects, payment records also include tags — names of the sites and locations where the crews are working. This allows the company to, within seconds:
- filter all expenses and income by a specific client or site;
- see how much each object generated;
- generate a report with the desired level of detail.
A pleasant bonus was the ability to plan all inflows and outflows by project and not only see the current budget status but also forecast the future result.
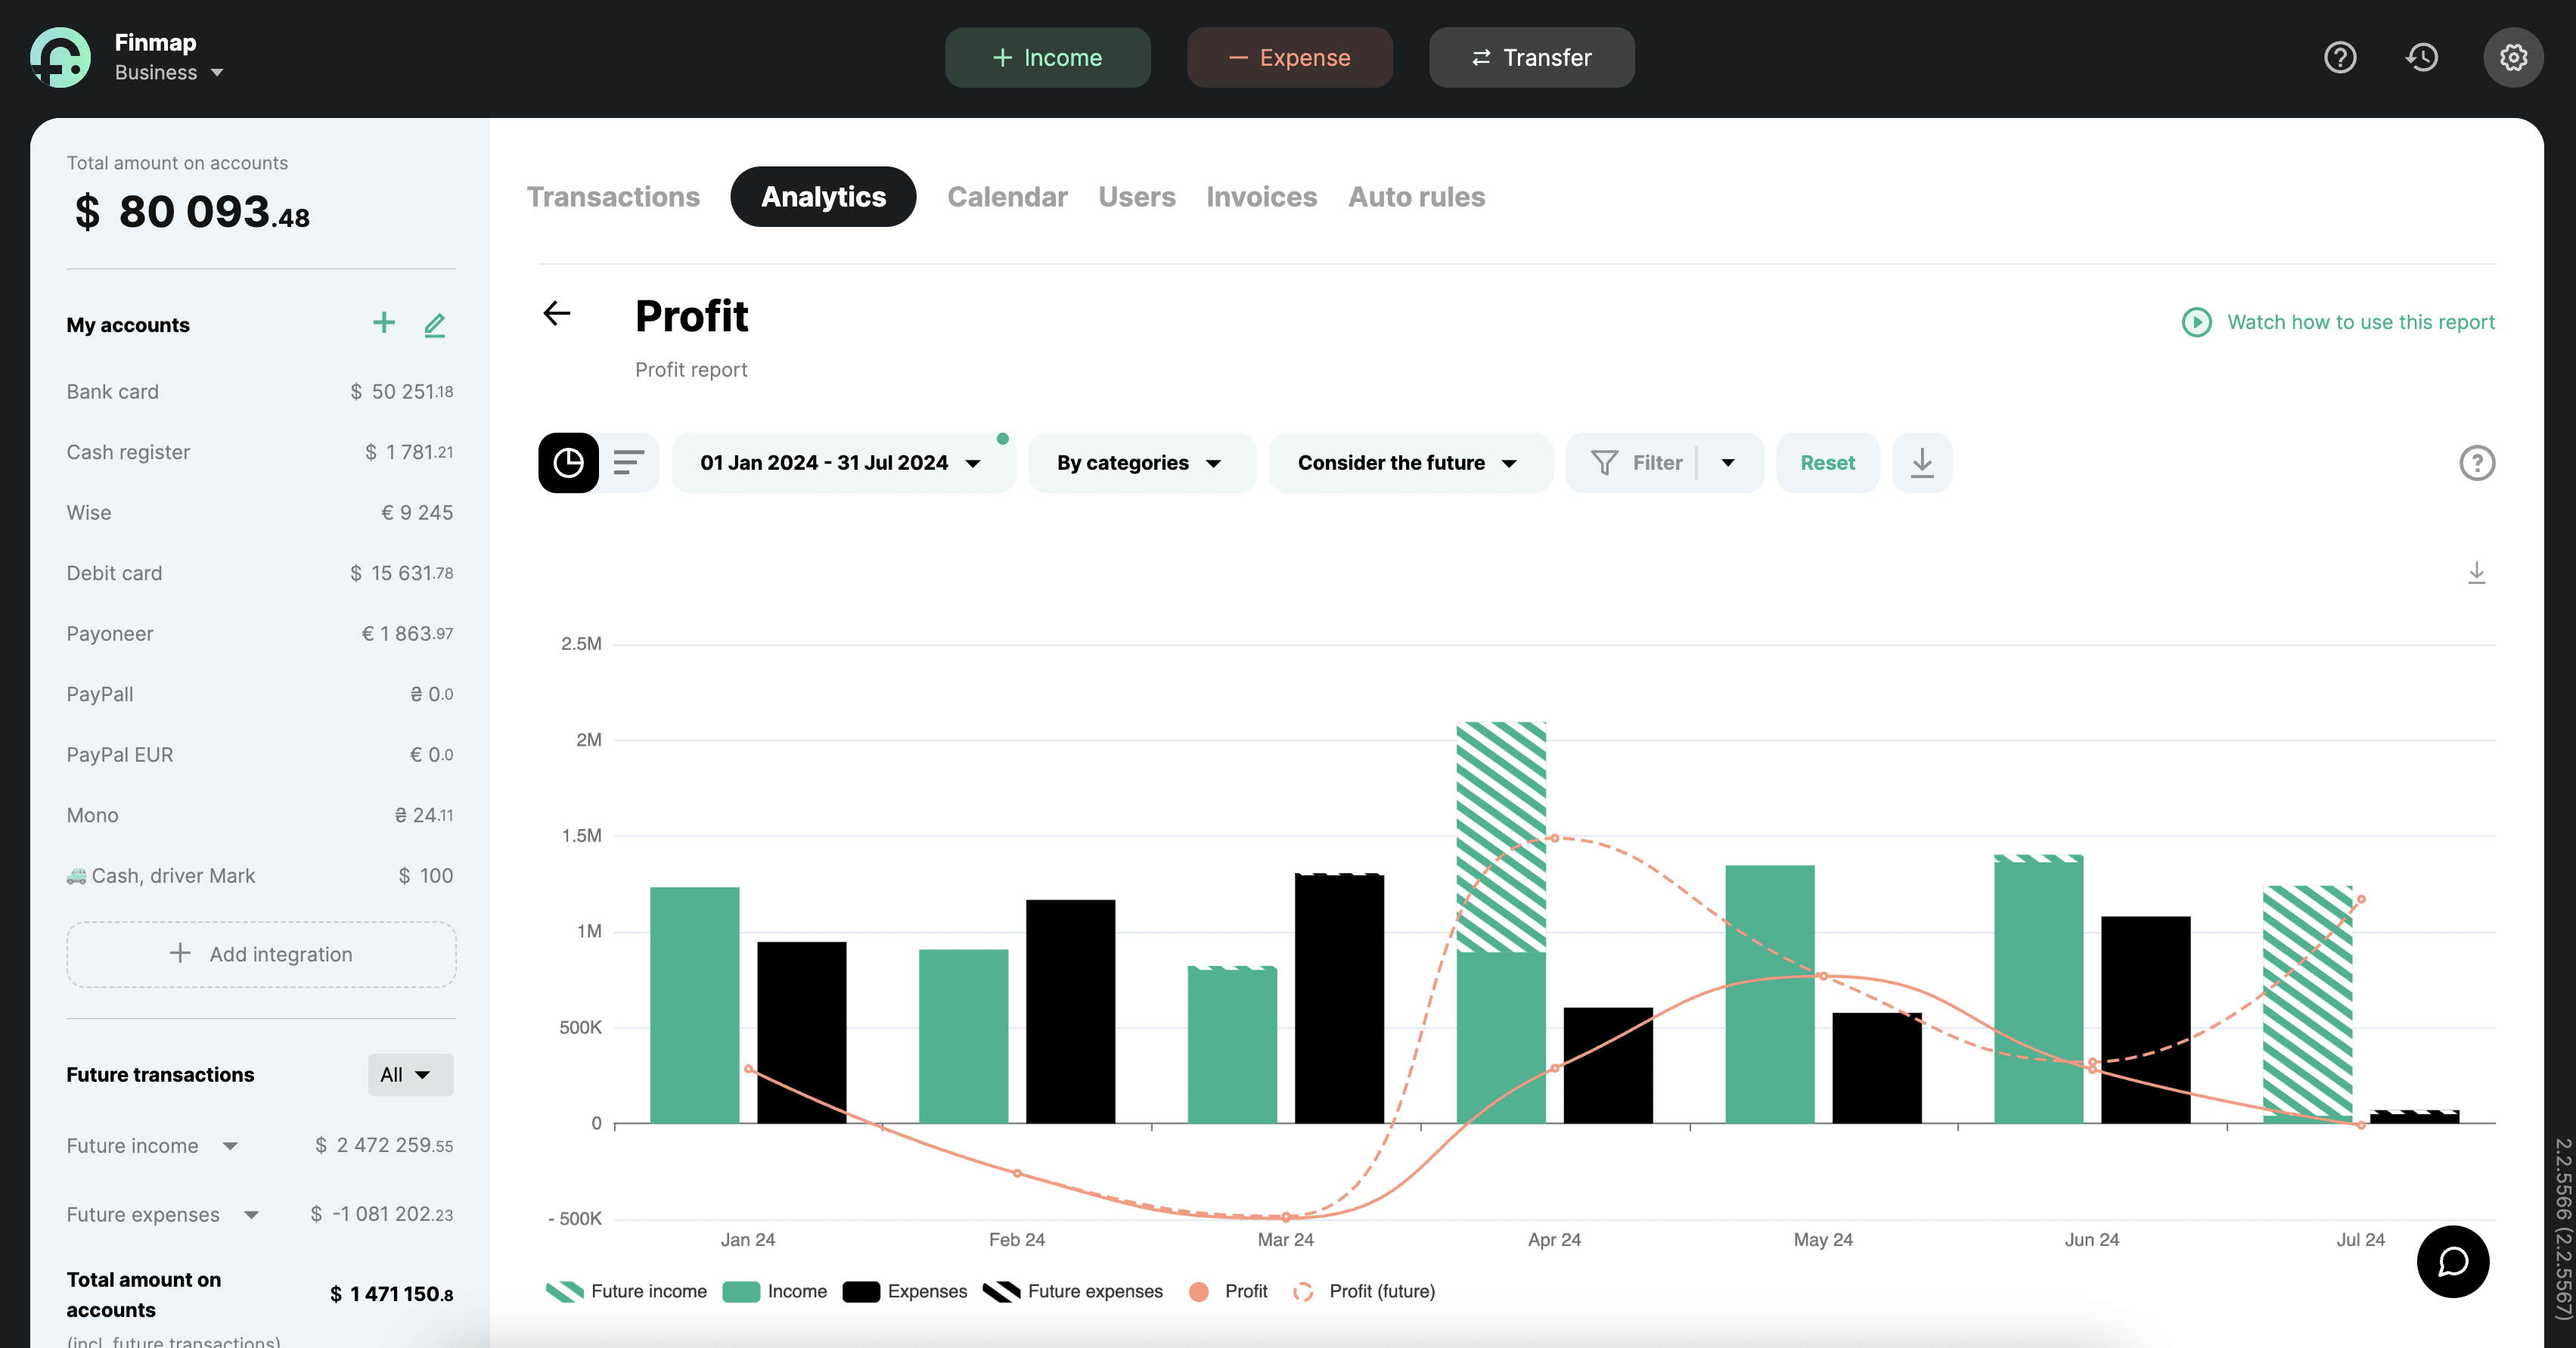
The “Profit” Report: Strategic Decisions, Not Gut Feeling
Once financial management was implemented, the P&L report became the main source of answers for the owner:
- What is the company’s real profit?
- How much in dividends can be withdrawn now — without harming future periods?
- Which project is worth scaling?
- Where are we losing margin, even though it seems like “everything’s fine”?
Custom reports were also created based on saved filters. This detailed the financial results of each project. Now the owner has well-founded information on the profitability indicators of each of them.
Petty Cash Without Chaos: Mobile Apps
The issue of petty cash was resolved in a very sustainable way. A separate account was created for each foreman. No access to the company’s general budget — only to their own accountable funds.
Employees no longer struggle with reporting, as they can now enter the expense right away in the mobile app, attach or take a photo of the receipt, and not worry that a purchase might be forgotten.
Result:
- less stress for employees;
- a complete financial picture for the manager;
- zero losses and confusion.
This solution not only improved financial management but also reduced tension within the company. The foremen don’t spend time after work or on weekends — they enter the data immediately while on-site, which is convenient for both staff and management.
This case is not an exception — it's an example of how proper financial analytics transforms business management.
Finmap didn’t just gather numbers in one place — it gave the owner a clear understanding of what’s working and what’s dragging the business down.
While others rely on gut feeling, this company makes decisions based on facts. Because business is not a game of chance. It’s about control, structure, and confidence in tomorrow.
Want to make well-grounded decisions instead of relying on luck? Work with numbers — work with Finmap.
Share valuable content — become a source of insights

Recommended for Entrepreneurs