Table of Contents
801
11 min
18.06.2026
₴500K in May, ₴160K in July: The Cashflow Discipline Seasonal Businesses Skip
Sergiy Shuldik
Financial Expert at Finmap
"By the third week of July, I realized the consolidated balance was dropping by ₴30,000 every Friday. We had ₴320,000 in May. By August we had ₴80,000. Nothing changed — except the season."

She runs an after-school education business. Five years old. Fourteen people on the team — twelve teachers, two admin. Annual revenue: ₴4,800,000. By external measures, a successful and growing business.
May had been her best month ever — ₴520,000 in revenue, with 18 groups full and a waiting list. Buoyed by the energy, she had hired one additional teacher in early June and committed to a new classroom rental starting September. Both decisions made sense at the time.
Then summer hit.
June revenue: ₴280,000. July: ₴160,000. August: ₴140,000.
Fixed costs hadn't dropped. The teachers were still on payroll. Rent was still due. Utilities, subscriptions, the accountant — all the same. The new teacher she'd hired in June was on full payroll through three of the slowest months of the year, performing maintenance work because there were no groups to teach.
By the third week of August, the consolidated business balance was ₴42,000. Two weeks from a payroll she didn't know how to make.
This is a story about a kind of cashflow trap that almost every seasonal business walks into — even the ones whose owners would tell you "yes, of course we're seasonal." Knowing you have seasons is not the same as planning for them. This article is about the discipline that lives in the gap between those two things.
The Paradox: Knowing You're Seasonal Isn't the Same as Planning for It
If you ask any seasonal business owner if their business is seasonal, they say yes. Schools have summers. Tax consultants have spring. Tour operators have the warm months. Wedding photographers have the season. Heating contractors have winter. Beauty businesses spike around holidays.
So why do most of them still get blindsided by the trough?
Because "seasonality" is treated as a fact about the calendar, not as a constraint on day-to-day decisions. The owner knows February will be slow. But in November, when revenue is strong and an opportunity to hire appears, the November-decision-maker forgets the February-reality. The two parts of the same brain don't talk.
Real seasonal cashflow planning has a different shape than non-seasonal planning. It treats peak months and trough months as one combined unit, not as a sequence of independent months. The fundamental question stops being "can we afford this?" and becomes "given that the next trough is ₪90 days away, how much of this peak revenue is actually ours to spend?"
"I knew September would be good. I knew July would be bad. But when July came, I was surprised anyway — because in October, when I committed to the new classroom, I was making a non-seasonal decision."
Every Business Has Seasonality (Even the Ones That Say They Don't)
Before talking about how to plan, it's worth saying clearly: almost every business has measurable seasonality. Not just the obvious ones.
A few examples from real consulting conversations:
- B2B SaaS: revenue is smoother but new-deal volume drops 30–40% in late July, August, and the second half of December
- Marketing agencies: clients freeze budgets in early Q1 and late Q4 — even if revenue lags this by 30–60 days
- Construction: weather and inspection cycles create a 2–3x swing between peak and trough months
- E-commerce: Black Friday → January slump is a 3–5x swing for most categories
- Consulting/services: vacation seasons (August, late December) drop billable hours 40–60%
- Restaurants: weekly seasonality (Mon vs Sat) overlays monthly seasonality (Feb vs Dec)
If you've been telling yourself "we're not really that seasonal," pull 24 months of revenue and look at it month by month. The pattern is almost always there — and almost always larger than you'd guessed.
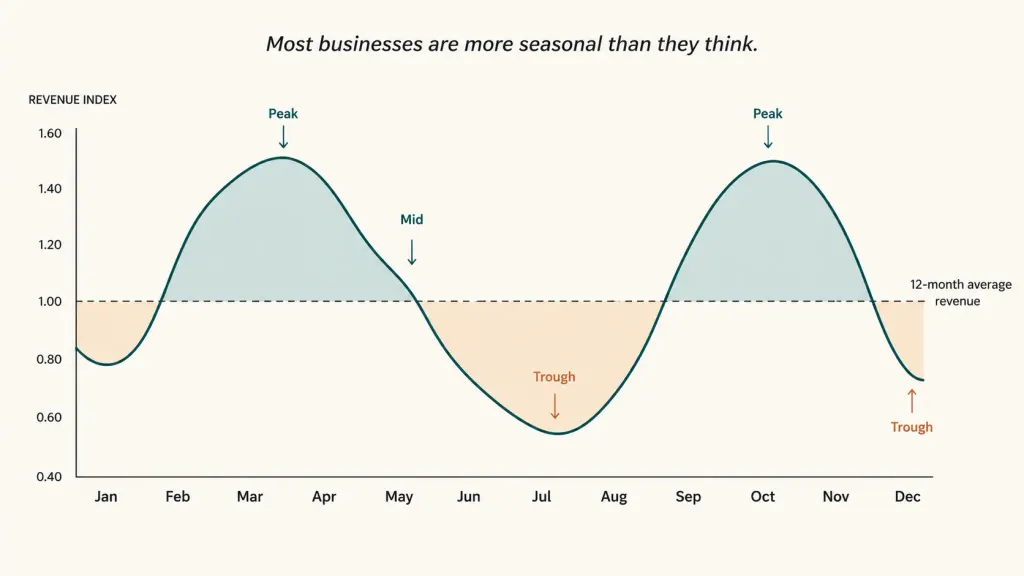
The first discipline of seasonal cashflow planning is building the seasonality map: a 12-month chart with bars showing typical revenue per month, derived from at least 24 months of history. Without this map, every decision is being made blind.
The Four Anti-Patterns of Seasonal Businesses
Across consulting calls with dozens of Ukrainian seasonal businesses, the same four anti-patterns repeat — and the after-school owner from the opening had committed all four in eight months.
Anti-pattern one. Denial. "We're not really that seasonal." Said by the owner of a business with a measurable 3× revenue swing between peak and trough. Denial is the cheapest anti-pattern because it requires no action — and it's the most expensive because every decision after it ignores reality.
Anti-pattern two. Recency bias. "Last month was ₴500K, so we can afford ₴500K-level spending." The brain treats the most recent month as the new baseline, even when 24 months of data shows it's an outlier. Hires get made, equipment gets bought, leases get signed — all anchored to a number that was always going to be temporary.
Anti-pattern three. Peak-pricing decisions. Making fixed commitments during peak months that have to be honored during trough months. The classic version: signing a 12-month lease for a bigger space in October when revenue is strong, then paying for the empty bigger space in July when revenue is one-third of October. The lease doesn't care what month it is. Neither do salaries.
Anti-pattern four. The buffer raid. The owner intellectually knows they should set aside a "season buffer," and intends to — but never does it systematically. When the predictable trough arrives, there's no buffer to absorb it. The fact that the trough was predictable is no consolation when the bank balance hits ₴42K.
The fix for all four lies in a single framework that converts the "I know we're seasonal" awareness into the operational decisions that actually need to change.
The Smoothing Framework: What Peak Months Owe Trough Months
Real seasonal cashflow planning works backwards from the trough.
Step one — calculate the trough months' funding gap. Take your annual fixed costs. Divide by 12 to get monthly fixed costs. Subtract trough-month revenue. The result is the per-month funding gap during the trough.
For the after-school business: fixed costs ₴290K/month, trough revenue ₴160K/month, gap ₴130K/month. With 3 trough months, total trough funding need: ₴390K. That ₴390K is what the peak months owe the trough months.
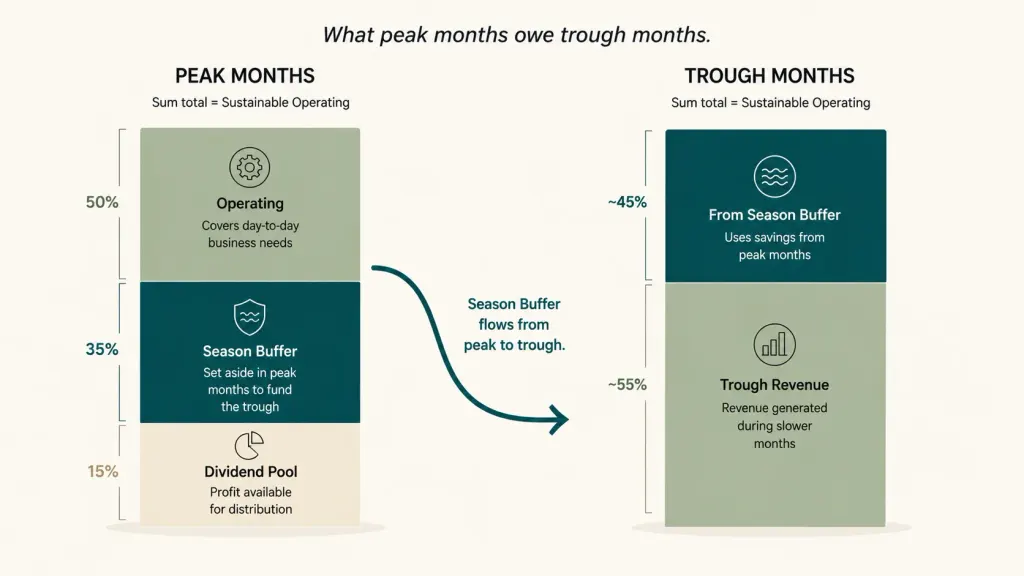
Step two — set the peak revenue spending cap. Most seasonal businesses can sustainably spend 50–60% of peak revenue on current operating, route 30–35% to season buffer, and reserve 10–15% as actual distributable profit. The cap is the discipline. Spending 90% of peak revenue means there's nothing left for the trough that's coming.
Step three — build the season buffer over the entire peak. Don't try to fund the buffer in one or two months. Allocate consistently across all peak months so it grows steadily and predictably.
For the after-school business with ~6 peak months averaging ₴450K/month: 30% allocation = ₴135K/month × 6 = ₴810K accumulated season buffer. Comfortably above the ₴390K needed. The excess becomes a strategic reserve.
Step four — set the "off-limits during peak" decision rules. No new hires committed based on peak-month revenue. No equipment purchases timed to peak-month cash. No new fixed-cost commitments unless they would still be affordable at trough-month revenue. This rule alone prevents 70% of the trouble seasonal businesses get into.
Step five — review the seasonality map quarterly. Patterns shift. New product lines change the curve. Macro events (war, inflation, demographics) change customer behavior. The map you built two years ago may already be wrong. A quarterly 30-minute review keeps it useful.
What the After-School Business Changed in 12 Months
By the end of August in our case study, the owner had survived — barely. Two clients prepaid for fall semester to bridge the gap. She personally went two weeks without her own salary. The new teacher hired in June was kept on, doing curriculum prep, on the agreement that she'd justify herself in September.
Then she did three structural things over the next 90 days.
She built the 24-month seasonality map. First time. Plotted every month of revenue. Saw the pattern with full clarity for the first time — the peaks were higher than she'd realized, and the troughs were deeper. The May-July swing was 3.25×. Knowing the actual number changed how she thought about every future decision.
She set the peak revenue spending cap. Starting in September, every incoming revenue split was: 55% operating, 30% season buffer, 15% strategic/dividend. The split was non-negotiable and tracked weekly.
She instituted the "off-limits during peak" rule. No new hires committed during peak months. No new leases signed during peak months. No new equipment based on peak-month cash. If something looked compelling during peak, it got modeled against the trough math before any commitment.
Twelve months later:
- Peak month average: ₴495K (up slightly from prior year, as the business grew)
- Trough month average: ₴175K (similar to prior year)
- Season buffer by end of October: ₴720,000 (vs ₴42K the previous year)
- June–August survival: zero stress, no prepayment requests, owner kept her salary
- Bonus paid to team in November: ₴85,000 (out of strategic reserve — possible because peak hadn't been overspent)
- Net profit for the year: ₴1,240,000 (vs ₴1,060,000 prior year, despite less spending in growth)
The business grew. The team got paid more. Summer wasn't terrifying anymore.
"What changed wasn't how seasonal we were. What changed was that I stopped pretending the seasons would forgive me if I planned around the wrong month."
Topic foundation: Cash Flow Gap: How to Identify It and How to Prevent It
Share valuable content — become a source of insights


Frequently Asked Questions
How much history do I need to map seasonality?
Minimum 12 months, ideally 24. With 24 months you can distinguish "real seasonal pattern" from "one-off event in a single year." If you have less than 12 months, use industry benchmarks as a starting point and build your own map as data accumulates.
What if my business is new and doesn't have history?
Use industry data plus conservative assumptions. Most categories have known seasonality patterns — retail, education, hospitality, B2B services all have well-documented shapes. Assume your business will follow the category pattern with possibly larger swings (newer businesses have higher volatility). Build buffers larger than the formula recommends until you have your own data.
Is the 30% buffer allocation always the right number?
It depends on your trough-to-peak ratio. For a business with 1.5× peak-trough swing, 15–20% allocation is enough. For 3× swing, 30% is closer to right. For 5×+ swing (some retail), 40–50% may be needed. Calculate from your actual gap, not from a generic guideline.
Can I just take a credit line for the trough instead of building a buffer?
You can, but it's expensive. A ₴390K credit line used 4 months a year at 24% APR costs ₴31K annually — money that just disappears. A built-and-replenished season buffer at no cost achieves the same outcome. Credit lines are best as a backup for unusual events, not as a substitute for the buffer.
What if my season buffer goes unused?
Excellent problem. Use it for strategic moves — a planned hire when the right person becomes available, equipment that compounds returns, advance payments to suppliers for better terms, or transfer to the strategic reserve. Unused season buffer is not lost money — it's optionality.
How do I get my team comfortable with seasonal planning?
Be transparent about the math. Show the team the seasonality map and the buffer plan. Bonuses become possible specifically because the discipline held during peak. Trough months stop being scary because everyone knows the plan worked. The team starts thinking like an owner — which is the upgrade you've been waiting for.
Any questions left?
We are ready to answer them.

Finmap support