


Table of Contents

72

8 min

11.02.2025
Year-End Financial Results: How to Prepare and Analyze Reports

Oleksiy Bazyura
Financial Expert at Finmap
The start of the year is a chance to see the real picture of your business based on the previous period’s results. What worked best? Where are the hidden growth opportunities? How can you build a solid financial foundation for a successful start to the new year?
In this article, we’ll look at how to sum up the year’s financial results without missing important details, and how to get ready for planning the year ahead.

How to prepare your annual financial statements without the stress
Effective financial planning and performance analysis help businesses make informed decisions and avoid costly mistakes. Follow these tips to make your year-end reporting process more accurate and easier to manage.
- Close the year in early January, not at the very end of the calendar year. This gives you time to collect and organize all the data for the previous period, even if some payments came in late.
- Set up regular monitoring of your financial position to reduce the risk of unpleasant surprises at the end of the reporting period.
- Use specialized financial tools throughout the year to collect and store your data in one system.
Key metrics for assessing a company’s financial health
Financial analysis is the foundation of effective business management. To make the right decisions, it’s not enough to simply record income and expenses — you also need to track key indicators, monitor how they change over time, and spot patterns.
This helps you identify the strengths and weaknesses of your business, optimize costs, and improve financial results. Let’s look at which metrics are worth analyzing and how understanding them can increase profitability and strengthen your company’s financial stability.
- Sales volume in monetary terms. This metric should be analyzed across key product, service, and project categories, compared with previous periods, and reviewed in light of the factors that influenced any fluctuations.
- Net cash flow, according to the Cash Flow report, shows the relationship between the company’s income and expenses month by month. Cash flow analysis helps identify periods with a negative balance and the sources available to cover those gaps — which is essential for planning future cash flows.
- Total business profit for the year is a key indicator of financial performance. It reflects the financial outcome of your operations and helps you assess changes compared with the previous year.
- Monthly profit trends show the seasonality of the business. If profit regularly spikes or drops, this allows you to adapt your financial strategy, optimize costs, and adjust marketing activity.
- Profit by business area — projects, locations, sales outlets, product groups, services, and so on. This metric helps identify the most profitable products and services, so you can allocate resources more effectively and focus on promising areas.
- Margin by key areas and projects shows how much net profit each area or project generates after variable costs are taken into account, which is critical for strategic business management.
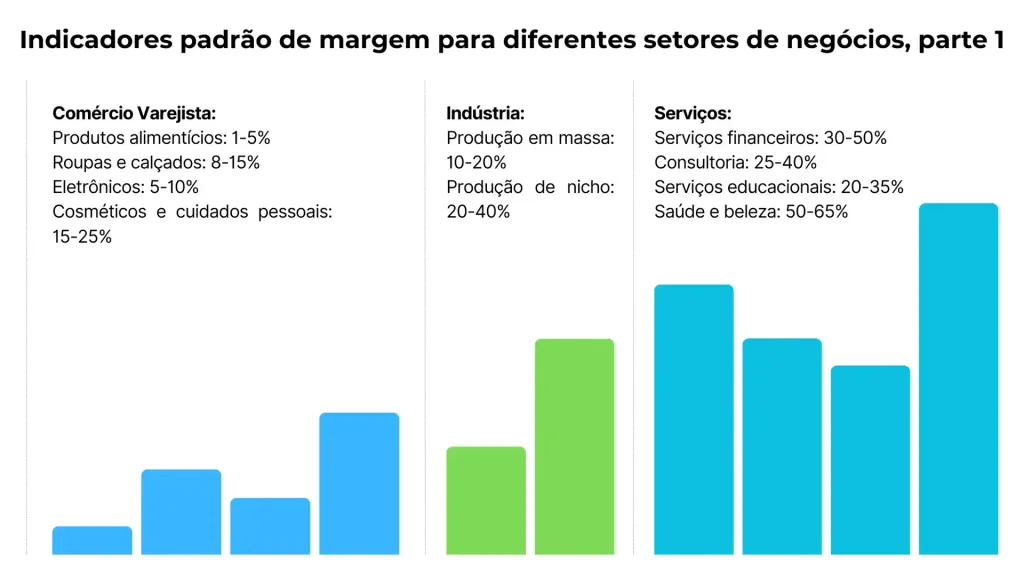
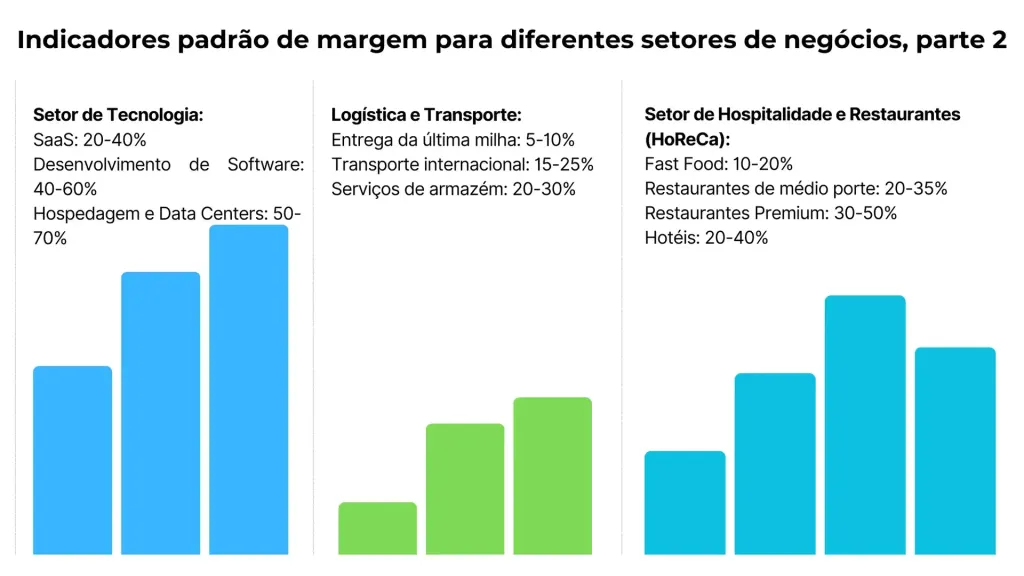
- Key expenses as a share of sales helps you assess the proportion of each expense category, understand its impact on overall financial results, and keep track of how it changes over time. If the share of major expenses is constantly rising, it’s a sign that your cost strategy needs to be reviewed — especially if sales are growing more slowly.
- Business profitability for the year is a relative profitability metric used to compare your results with market averages. Comparing it with last year’s data shows whether operational efficiency is improving.
- The company’s financial position: analysis of assets and equity, as well as the relationship between working capital and current liabilities. Based on the management balance sheet, this metric helps assess changes in the structure of assets and liabilities, evaluate the company’s ability to meet its obligations, and understand how effectively profits are being used.
- Other important metrics for your business may include: ROI (Return on Investment), LTV (Customer Lifetime Value), MRR (Monthly Recurring Revenue), break-even point, unit economics, and more.
Regularly reviewing your key financial indicators allows you to stay in control of your financial health and uncover hidden growth opportunities. A strong business is not built on guesswork, but on accurate data.
That’s why it’s not enough to simply look at the numbers — you need to understand what they mean, learn to forecast risks, and act proactively. Businesses that analyze their finances systematically gain stability and a competitive edge, which ultimately shapes the company’s future.
How annual analysis improves your company’s financial health
Annual analysis is not just a way to evaluate how well your company performed. It’s also an important strategic planning tool that allows you to:
- Adjust your current business processes.
If your company faced working capital shortages during the year, failed to account for seasonality, or saw sales momentum decline, that’s a clear sign that changes are needed.
- Carry out a deeper analysis of the company’s financial position.
Pay close attention to the relationship between working capital and current liabilities to avoid cash gaps. Profitability and margin metrics should be used to assess how efficiently resources are being used.
- Make decisions about the company’s key areas of focus.
Annual analysis helps identify the most profitable projects and evaluate the cost of maintaining unprofitable operations, as well as their impact on overall financial efficiency. Based on this report, you can uncover insights into alternative monetization options or ways to restructure loss-making assets.
Define the break-even point for each business area in advance, so you can keep those indicators under control throughout the year. This will allow you to take corrective action in time and maintain financial sustainability.
- Develop a growth strategy based on real market conditions.
Use the data you’ve collected to benchmark against market indicators and adapt your strategy to external changes. Market shifts may require changes to your pricing policy or product portfolio.
How annual analysis supports strategic decision-making
Assess possible business development scenarios based on financial data and prepare flexible strategies for different economic conditions — growth, downturns, or changes in demand. This will help the company quickly adapt to market fluctuations and maintain long-term financial stability.
Annual reports are also one of the key foundations for building a financial business model, which in turn helps answer questions such as:
- how to earn more in a predictable and consistent way;
- how to keep the business above break-even;
- whether opening a new business line is profitable;
- how to avoid crises.
That’s why consolidating your annual results helps you analyze company performance and make well-grounded management decisions about future development. It’s worth noting that getting accurate annual results quickly is only possible when you have a well-established system of regular accounting.
Finmap will help you organize your finances and become your reliable guide in the world of numbers. Financial reporting will no longer be a headache!
Share valuable content — become a source of insights