Table of Contents
178
12 min
25.06.2026
Financial Model for a Small Business: What It Is and How to Build One
Sergiy Shuldik
Financial Expert at Finmap
"For three years I had a spreadsheet I called my financial model. It was a forecast — a single line of next year's numbers, extended forward from last year's. The first time I built a real model, I realized the spreadsheet had been answering the wrong question for three years."
A founder running a small marketing consultancy described the moment of realization clearly. For three years she had been maintaining a spreadsheet she called her financial model. It had next year's projected revenue across the top row, projected costs down the side, and a calculated profit at the bottom. She updated it once a year, around budgeting season. She thought of it as her plan.
The first time she sat down with a financial advisor to build an actual financial model, she discovered her spreadsheet had been answering one question and one question only: what do I think next year will be?
A real financial model asks a different set of questions: what if revenue grows 20% instead of the expected 10%? What if we hire two more people in Q2 instead of Q3? What if our top client leaves? What if costs grow 5 percentage points faster than revenue? Where does cash get tight under each of these conditions, and by how much?
The difference between her spreadsheet and a real model wasn't in the math. It was in what the document was built to do. A forecast is built to predict. A model is built to let you ask questions and see consequences before you commit.
This article is about that difference — and about how an owner with no finance training builds her first real model in a weekend.
The Paradox: A Model Isn't a Prediction — It's a Question Machine
Most owners, when they hear "financial model," picture a precise spreadsheet that predicts the future. They then conclude (often correctly) that precise predictions of the future are impossible for a small business. So they decide a model isn't worth building.
This logic is correct about predictions and wrong about models. A financial model isn't trying to predict the future. It's trying to make the consequences of different futures visible before they happen.
The owner doesn't need to know what next year will be. The owner needs to know:
- If next year is normal, can we afford the hire we're considering?
- If next year is weaker than normal, when does cash get tight, and by how much?
- If next year is better than normal, what should we have prepared so we can capture the upside?
These three questions are answered by running three scenarios through the same model — not by predicting which scenario is right. The model's value is in the comparison, not in the prediction.
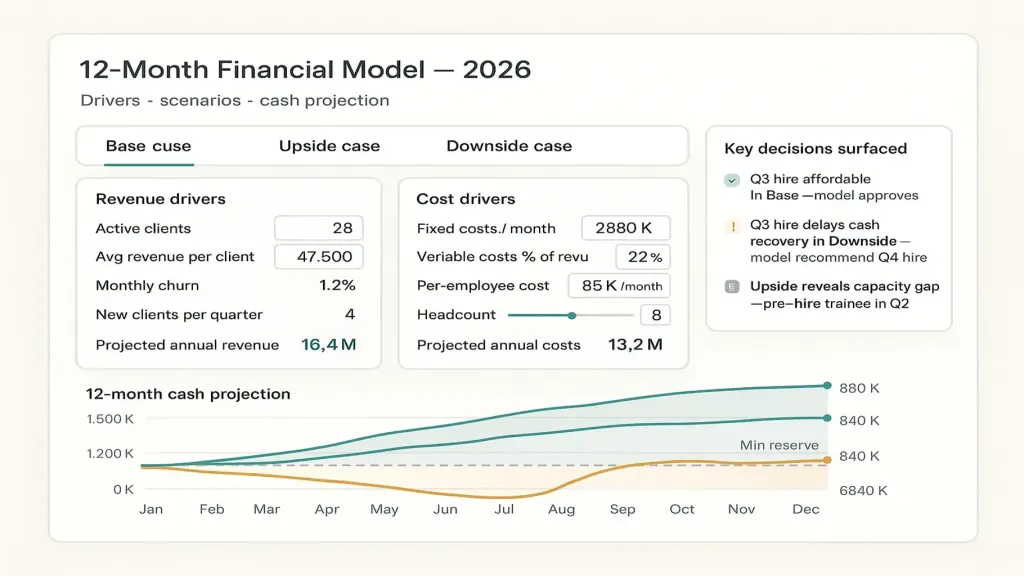
A founder who has a real model doesn't say "we expect ₴8M in revenue next year." She says "in our base case, we end the year with ₴840K cash; in our downside case, we get tight in August and may need to delay a planned hire; in our upside case, we have ₴1.4M and should consider opening a second office." Each scenario is informed. The decision is structured. The future is no longer one unknown — it's a range of conditions she's prepared for.
The financial model is one of the four core artifacts of management accounting introduced in the anchor article → Management Accounting Explained.
What a Financial Model Actually Is
A definition free of finance-textbook language:
A financial model is a structured set of assumptions about how a business operates, organized so that changing one assumption shows you the cascading consequences across revenue, costs, profit, and cash — over a forward time horizon.
Three things matter in that sentence.
"A structured set of assumptions." A model is not a list of predicted numbers. It's a list of drivers — the assumptions that produce the numbers. "Average revenue per client of ₴25K" is a driver. "Number of clients" is a driver. "Average employee cost per month" is a driver. "Tax rate" is a driver. Multiply and add these correctly, and you get a projected P&L and cash flow. Change one driver, and everything downstream changes automatically. That's what makes it a model rather than a static forecast.
"Cascading consequences across revenue, costs, profit, and cash." A change in one driver should ripple through the entire document. If you add a hire, the model should automatically reflect higher salary costs, a different productivity profile, possibly higher revenue (if the role is revenue-generating), changes in payroll taxes, the cash impact of the hire's first three months before productivity arrives. A static spreadsheet doesn't cascade. A model does.
"Over a forward time horizon." Usually 12 months for small businesses, sometimes 24–36 for businesses with longer planning cycles. The horizon matters because it forces you to project — to think about not just this month's costs but how they evolve, when new commitments compound, when reserves get rebuilt.
A real model has those three properties. Most spreadsheets owners maintain have one or two of them, at most.
The Four Components of a Basic Model
You don't need a McKinsey-grade model to make better decisions. A small business model has four core components.
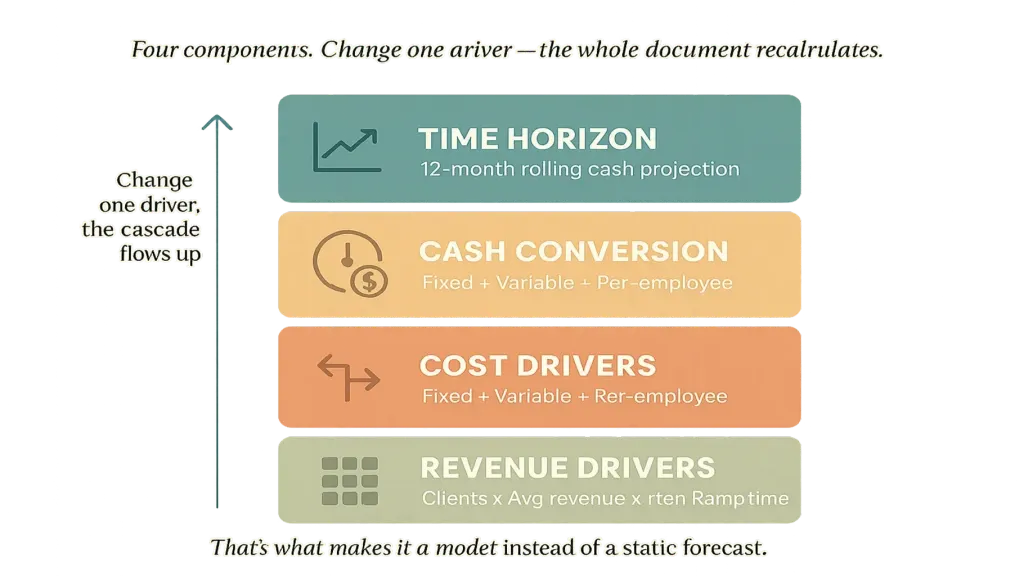
Component two — Cost drivers. Separate fixed costs (rent, baseline salaries, subscriptions) from variable costs (those that move with revenue: payment processing, direct project costs, sales commissions). Separate from those: per-employee costs (you can then model "what if we add two designers?"). A good cost-side breakdown turns "what does it cost to run this business?" into a function of size, not a static number.
Component three — Cash conversion. Profit and cash aren't the same thing. A profitable business can run out of cash. Your model needs to convert the P&L projection into a cash projection by accounting for: payment terms (clients paying net-30 vs net-15), supplier payment timing, tax payments on specific dates, owner draws, equipment purchases. Article #13 → covers the payment calendar that the cash component connects to.
Component four — Time horizon. Roll the first three components forward over 12 months (or longer). The model now shows: revenue per month, cost per month, profit per month, and cumulative cash position at the end of each month. The cash line is what tells you whether a scenario is survivable.
Together: drivers → revenue projection + cost projection → profit projection → cash projection over time. Change any driver, and the whole document recalculates. That's a model.
The Three Scenarios Every Model Should Run
A model with one scenario is still mostly a forecast. The value emerges when you run the same model under three different sets of assumptions.
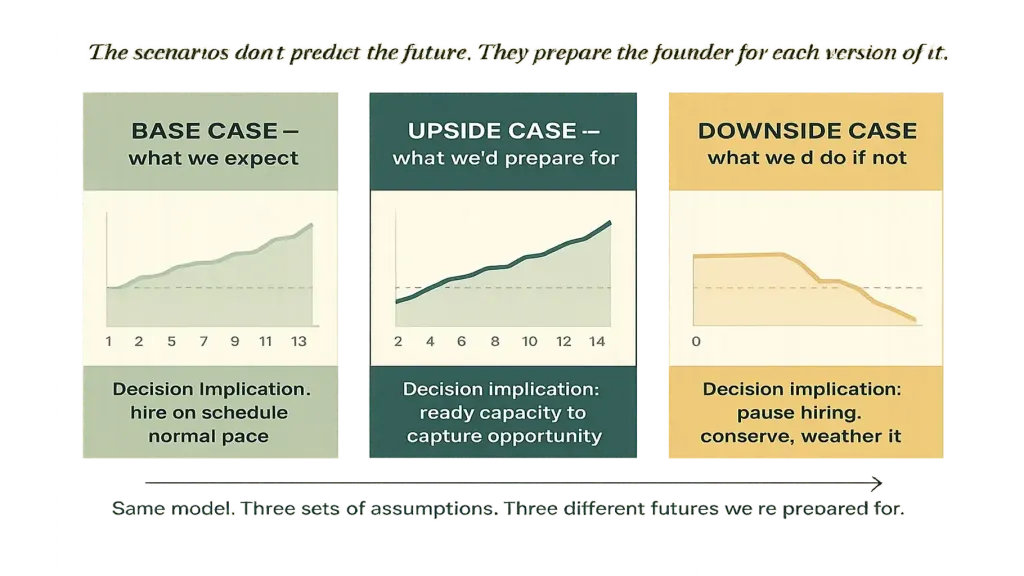
Upside case. Apply assumptions that are realistically optimistic — not "if everything works perfectly," but "if the things we're working on actually pay off." Revenue grows faster. The new service line we launched generates 50% more than planned. The marketing test pays off. Run the same model with these assumptions. The upside case answers: if things go well, what should we be prepared to do — what extra hires, capacity, reserve buildup should we be ready for?
Downside case. The realistic-but-uncomfortable scenario. Revenue grows slower than expected. The top client churns. A planned launch slips. Run the model. The downside case answers two critical questions: does the business survive, and what would we have to do — pause hiring, cut variable costs, defer the owner's draw — to make sure it does?
A founder who has thought through all three scenarios makes very different decisions than one who has only thought through the base case. Specifically: she takes risks confidently when the downside is survivable, and she doesn't overcommit when even the base case is fragile. The scenarios don't predict the future. They prepare the founder for each version of it.
How to Build Your First Model in a Weekend — the 5-Step Process
A first model takes 4–8 hours of focused time. Most owners break it across a Saturday and Sunday.
Step one — list your revenue drivers (60 minutes). Don't write a revenue number. Write the drivers that produce it. For a service business: existing clients with their average billing, expected new clients per quarter, churn assumptions for each. For a product business: SKUs, unit prices, expected unit volumes. The output of this step is a small driver sheet that produces a monthly revenue projection by formula, not by hand.
Step two — list your cost drivers (60 minutes). Fixed costs as a list (rent, baseline salaries, tools, accountant). Variable costs as a percentage of revenue (payment processing, project delivery costs, sales commissions). Per-employee costs separated. The output: monthly cost projection from drivers.
Step three — calculate profit and cash (60 minutes). Revenue minus costs = profit. Profit adjusted for payment timing = cash flow. Starting cash + monthly cash flow = cumulative cash position. The output: a monthly cash projection for the next 12 months. The cash line is the most important output of the model.
Step four — build the three scenarios (90 minutes). Copy the model twice. For the upside copy, adjust revenue drivers up and cost drivers conservatively. For the downside copy, adjust revenue drivers down and cost drivers stay (or grow). You now have three parallel projections.
Step five — surface the decisions (60 minutes). Sit with the three projections side by side. Ask three questions: (1) where do they differ most? (2) which decisions you're currently making would change under each scenario? (3) what's the single biggest risk you didn't see before doing this exercise? The decisions surfaced here are the model's real product. The numbers are just inputs to them.
By the end of the weekend, you have a model that tells you things you didn't know about your business — and a structure you can update monthly with 30 minutes of attention.
Six Mistakes That Make a Model Useless
Across consulting calls with owners who tried to build models, six mistakes appear over and over.
Two — modeling revenue without modeling its drivers. "We'll do ₴8M next year" with no breakdown into clients × average billing × retention. This makes the projection look authoritative while hiding all the assumptions that would let you stress-test it.
Three — confusing profit and cash. A model that shows P&L but not cash flow will tell you a business is profitable while it runs out of cash. Profit and cash diverge through payment timing, tax obligations, and capital investments. Both lines belong in the model.
Four — using the model as a budget enforcement tool. Some owners build a model and then use it to scold themselves when reality diverges. The model isn't a budget to defend — it's a question machine to update. When reality diverges, the right response is to update the model with what you've learned, not to feel bad about being wrong.
Five — never updating it. A model built in January and never touched is wrong by March. Update monthly with actuals — the same 30 minutes that you spend on the operating P&L review. Article #12 → covers the cadence discipline that makes ongoing model maintenance sustainable.
Six — confusing the model with the platform. A spreadsheet model is fine for the first version. After 6–12 months, most owners switch to a platform that integrates the model with the bookkeeping data so it auto-updates. Article #3 → covers the platform option directly.
📌 See what a real financial model looks like — drivers, scenarios, cash projection, decision surface — in one integrated view. Book a 20-minute Finmap demo. We'll walk through a model on real example data and show how the three scenarios surface decisions you're not seeing yet. Book a Finmap demo →
Read also
- Financial model: from idea to first million
- How to read a P&L report
- Finmap Findirector: plan your finances
In this topic
- How to Read a P&L Report — And Why Most Owners Miss the Real Signal
- Money Down the Drain? How a Profit and Loss Statement Can Save Your Business
- From an Idea to a Million: How a Financial Model Can Make It Happen
- Financial Results of the Year: How to Prepare and Analyse Reports
- Sales ≠ Profit: How to Stop Margin Bleed in 10 Minutes a Day
- 4,800 Covers, ₴47K Loss: Why Restaurants Can't Feel Their Break-Even Point
Share valuable content — become a source of insights


Frequently Asked Questions
My business is too small for a financial model. Should I wait?
No. The model gets harder to build with embedded complexity. A ₴500K business that builds a basic 12-month model today is establishing the practice; a ₴5M business trying to build one from scratch struggles with all the historical complexity that's already there. Start simple. Even one driver sheet plus three scenarios is a real beginning.
Should the model be in Excel or a platform?
For your first version — Excel or Google Sheets is fine. The work of building the model is mostly thinking, not tooling. After 6–12 months, most owners switch to a platform that integrates the model with the rest of management accounting outputs. Article #3 → covers the platform shift.
How accurate does the model need to be?
Less than you'd think. The model's value is in surfacing decisions and stress-testing them, not in precision. A model that's "right" within 15–25% on revenue and 10% on cash is far more useful than a "precise" projection that's never updated. Optimize for honesty and frequent updates, not for false precision.
What's the difference between a financial model and a business plan?
A business plan is a document explaining what the business does and how it will succeed. A financial model is the numerical structure underneath — what assumptions, what scenarios, what cash trajectory. A business plan for investors usually includes a financial model. A financial model for internal decisions doesn't need a business plan around it.
Should I share the model with my team?
A summary, usually yes. The scenarios in particular — "here's what we'd do if things slow" — give the team confidence that there's a plan, not just hope. The detailed driver structure is usually kept at the leadership level. Article #12 → covers decision rights and information sharing.
How often should I update it?
Update monthly with actuals during the operating P&L review (15 minutes added to that review). Update assumptions quarterly during the strategic review. Rebuild from scratch annually as part of the planning cycle. Article #14 → covers how this fits in the cadence framework.
Any questions left?
We are ready to answer them.

Finmap support