Table of Contents
159
12 min
25.06.2026
How to Read a P&L Report — And Why Most Owners Miss the Real Signal
Sergiy Shuldik
Financial Expert at Finmap
"I read my monthly P&L every month for four years. I could quote our revenue and net profit. And I couldn't tell you which client was most profitable, which service line was losing money, or why our margin moved 4 points last quarter."
A founder of a small specialty agency described the situation cleanly. She had been receiving a monthly P&L from her accountant for four years. The reports were on time. They were professional. They were accurate. She read them carefully.
And she could answer almost none of the questions she actually had about her business.
Which client is most profitable per hour of team time? The P&L didn't show that. Which service line is losing money? The P&L didn't show that. Where did our gross margin move last quarter — and why? The P&L showed one aggregate gross margin number with no breakdown. If we drop our two least-profitable retainers, what's the cash impact? The P&L could be reverse-engineered for this, but not in real time.
The reports she was reading were genuine P&Ls. They were correctly formatted, mathematically accurate, and structurally complete. The problem wasn't the reports. The problem was that the reports were built for the tax authority, not for the owner — and she was reading them as if they were the same thing.
This article is about how to read a P&L properly. It's also about the difference between a P&L that satisfies regulators and a P&L that helps you decide.
The Paradox: The P&L Most Owners Read Isn't Built for Owners
The Profit and Loss statement is one of the oldest financial documents in business — older than the modern corporation. In its statutory form, it's required reading for tax filings, audits, and bank credit decisions. Every accountant produces one. Every bookkeeping software generates one. Most owners read theirs monthly.
And yet most owners get almost nothing actionable from it.
The reason is structural. The statutory P&L is built to answer the question "did this business operate legally and what taxes are owed?" Its aggregation, its categorization, and its level of detail all serve that question.
The questions an owner actually has — which clients are profitable, which products carry margin, where costs are growing, what decisions to make next month — require a different organization of the same underlying data. Same transactions, different lens. This distinction — bookkeeping vs management accounting — is the subject of article #2 in this series →
The good news: once you know what to look for, the statutory P&L still contains useful information. The better news: an operating P&L (the management version) makes the answers explicit instead of hidden. Both versions matter. The owner who reads both is the owner who decides better.
The Anatomy of a P&L — What Each Line Means
Before we talk about reading the P&L well, the basic structure. Every P&L — statutory or operating — has the same five major sections.
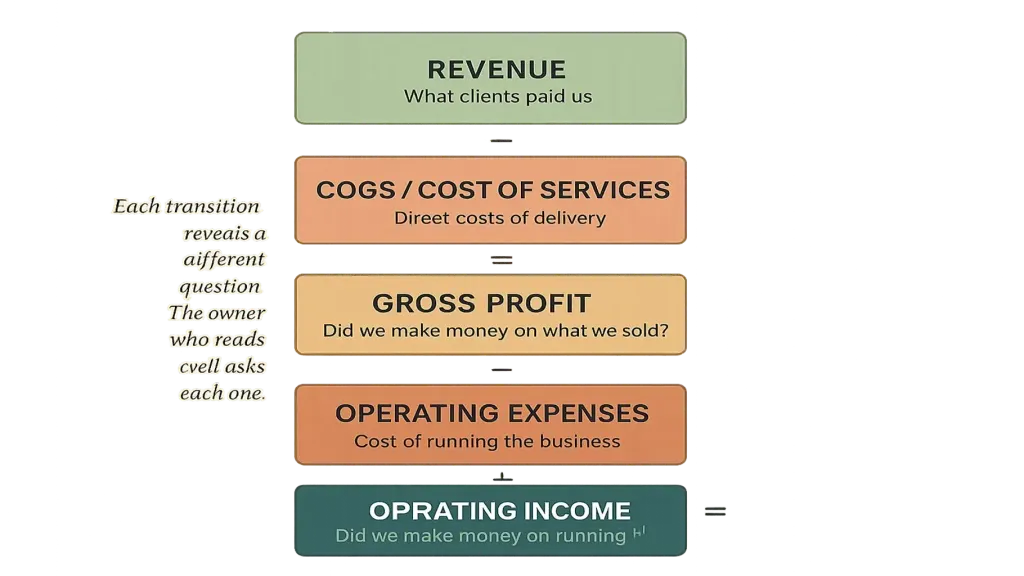
Section two — Cost of Goods Sold (COGS) or Cost of Services. The direct costs of producing what was sold — materials, direct labor, payment processing fees, subcontractor costs tied to specific projects. Subtract from revenue and you get gross profit.
Section three — Operating Expenses. Everything else needed to run the business — salaries not tied to direct production, rent, software subscriptions, marketing, accounting, owner's salary. Subtract from gross profit and you get operating income.
Section four — Other Income and Expenses. Non-operating items — interest paid on loans, foreign exchange gains or losses, one-off items. Subtract or add and you get pre-tax income.
Section five — Taxes and Net Income. Income tax applied (for legal entities). The final line is net income — what's left after everything.
The five sections matter not because of the math, but because each transition reveals a different question. Revenue → Gross Profit asks "do we make money on what we sell?" Gross Profit → Operating Income asks "do we make money on running the business?" Operating Income → Net Income asks "do we make money once everything's paid?"
An owner reading a P&L well doesn't just scan to the bottom line. The owner asks at each transition: what does this tell me?
The Four Most-Misread Lines
Across consulting calls with owners about their P&Ls, four lines come up over and over as routinely misread.
Line one — Revenue. Most owners read this number as "what we earned." The catch: revenue is what was recognized during the period, which isn't always the same as what was collected. A business with 30-day client payment terms shows revenue on the day of invoice — but the cash arrives a month later. Confusing these two means thinking you have money you don't yet have, or wondering where money is when it hasn't arrived yet.
Line two — Gross Profit / Gross Margin. This is the most strategically important line on the P&L — and the most commonly aggregated into uselessness. A "gross margin of 38%" for the whole business hides everything that matters: which products earn 60% gross margin, which earn 12%, which are loss-leaders that should be reconsidered. Reading aggregate gross margin without segmentation is reading a temperature average for a body with one healthy hand and one frostbitten hand.
Line three — Operating Expenses. Often presented as a few categories: "Salaries," "Rent," "Marketing," "Other." Each category aggregates dozens of decisions. Was that ₴48K of marketing spend on Facebook ads, on a paid sponsorship, on a conference? The aggregation hides which spend earned its keep. Owners reading aggregate OpEx tend to make blunt cuts when targeted cuts would serve better.
Line four — Net Income (the "bottom line"). This number gets disproportionate attention. It's also the line where the most misleading conclusions get drawn. Net income includes non-recurring items, depreciation, taxes — none of which respond to operating decisions. Operating income (Section 3 of the anatomy) is what the owner can actually affect through the business decisions she makes day to day. Reading only net income while ignoring operating income means making decisions about a number you don't control.
These four lines being misread accounts for the bulk of "I read my P&L every month and still didn't know what to do" experiences. The remedy isn't to read more — it's to read differently.
What an Operating P&L Should Look Like
An operating P&L is the same data, organized to answer owner questions. The transition from statutory to operating involves three structural shifts.
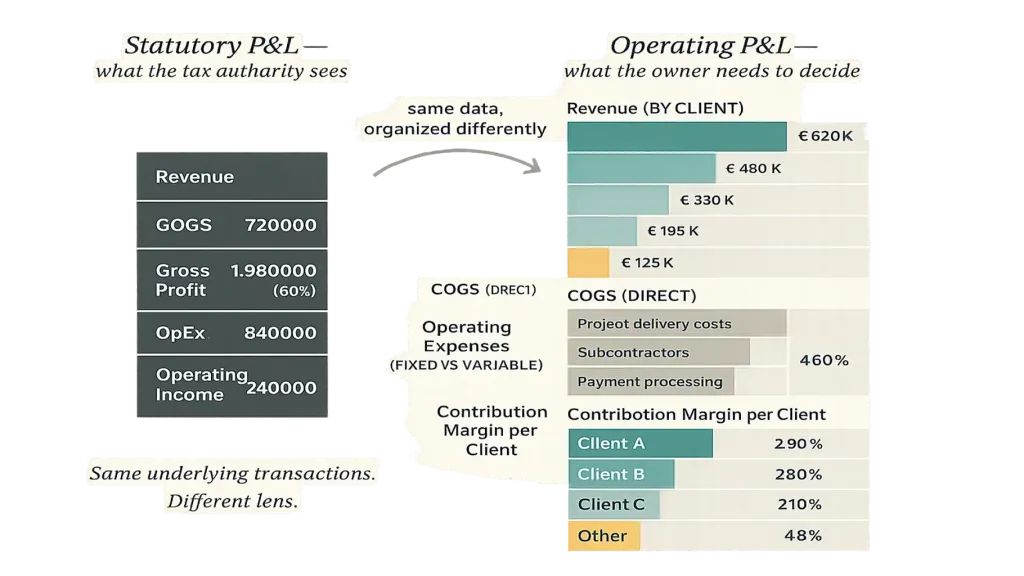
Shift two — separation of fixed and variable. Salaries (mostly fixed) and direct project costs (variable with revenue) shouldn't be presented as if they behave the same way. Separating them reveals the business's break-even structure, what scales with growth, and what doesn't.
Shift three — contribution margin per segment. The most useful number an operating P&L produces is contribution margin per client or per service line — the gross profit after direct costs are subtracted, before fixed costs are allocated. This number tells the owner exactly which clients and services contribute to keeping the lights on, and by how much. The decisions about pricing, hiring, client mix, and strategic direction are made from this number — not from aggregate net income.
A well-built operating P&L lets the owner see, at a glance, that Client A delivers ₴84K of contribution margin per quarter on ₴120K of revenue (70% margin, healthy), Client B delivers ₴18K on ₴95K of revenue (19% margin, unhealthy — investigate), and the events service line carries a 42% contribution margin while consulting carries 61%. None of this is visible on the statutory P&L. All of it is in the same underlying transaction stream.
Article #1 in this series → introduces the operating P&L as one of the four core artifacts of management accounting; article #3 → covers the platform that produces it automatically.
The Three Questions Every P&L Should Answer
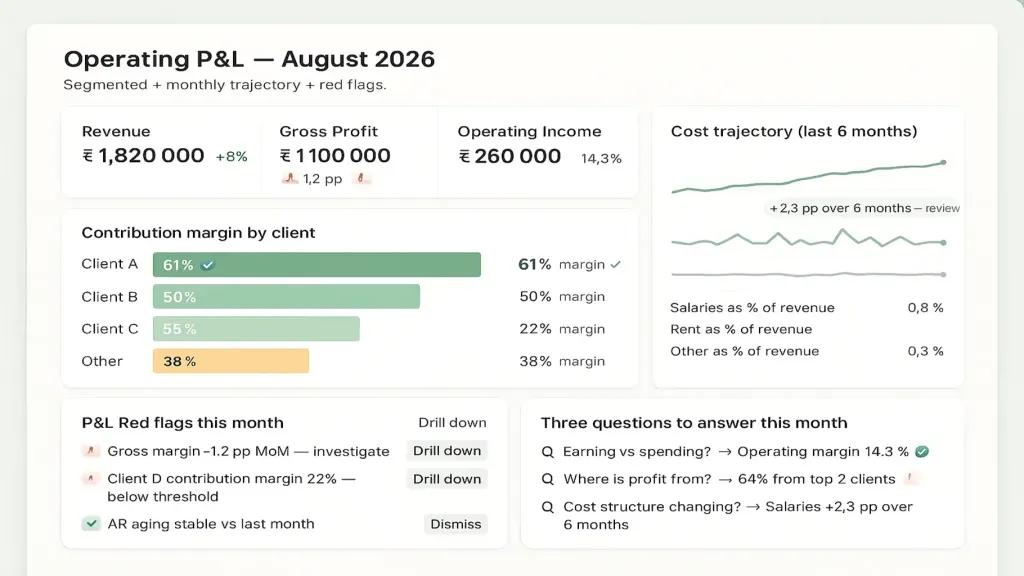
Reading a P&L well is not memorizing 30 lines. It's bringing three questions to the document and finding the answers.
Question one — are we earning more or less than we're spending, and by how much? The basic profitability question. Look at operating income, not net income. Compare to last month, last quarter, same period last year. If trending down, ask why.
Question two — where is our profit actually coming from? The segmentation question. Look at gross margin per client, per service line, per product. If one client or one segment accounts for the bulk of the contribution margin, that's both a strength (a profitable concentration) and a risk (single-point-of-failure exposure). Both deserve attention.
Question three — is our cost structure changing in ways we should respond to? The trajectory question. Look at major cost lines as a percentage of revenue over the last 6 months. If salaries went from 32% to 41% of revenue, ask whether that's a hire that hasn't paid off yet or a structural shift that requires action.
Three questions, monthly. Together they take 15 minutes if the P&L is well-built. They take an hour if you have to reverse-engineer answers from a statutory format. They take never if the P&L is aggregated to the point that the answers can't be found.
Six Red Flags to Look For During the Monthly Read
A monthly P&L read is also a chance to catch warning signs early. Six signals to watch:
Two — fixed cost growth without revenue growth. Salaries or rent going up while revenue is flat means operating margin is being squeezed silently. Quarterly trend, not single-month.
Three — concentration risk in revenue. If one client represents more than 30% of revenue, the P&L is hiding a strategic risk. A great month from that client masks a structural exposure that one bad month from them will reveal.
Four — a "negative gross margin" segment. If any service line or client shows a negative contribution margin (you're losing money on the work itself before allocating overhead), it should be investigated immediately. It often means underpricing or scope creep on that segment specifically.
Five — uncategorized or "Other" expenses growing. If the "Other" line on operating expenses is more than 5–8% of total OpEx, the bookkeeping is hiding something. Push for the categorization to be expanded.
Six — revenue recognized but not collected. If your AR aging is growing while revenue is flat or down, you're recognizing income on the P&L that you may never actually receive. Cross-check with the payment calendar. Article on the payment calendar →
A 15-minute read with these six red flags in mind catches 70% of the issues a business will have before they become crises.
📌 See what an operating P&L looks like for a business like yours — with the segmentation, contribution margin, and trajectory analysis built in. Book a 20-minute Finmap demo. We'll walk through a real example P&L and show how the management view answers the questions the statutory view can't. Book a Finmap demo →
Read also
Topic foundation: Financial Model for a Small Business: What It Is and How to Build One
Share valuable content — become a source of insights


Frequently Asked Questions
My accountant only produces a statutory P&L. How do I get to an operating P&L?
Three options: (1) ask your accountant to produce a segmented version monthly — feasible if they have the appetite for it; (2) work with a financial director or external finance professional to produce one — common for ₴3M+ businesses; (3) use a platform that produces both views from the same data stream automatically. Article #3 → covers the platform option directly.
Should I share my operating P&L with the team?
A summarized version, usually yes. The team understands the business better when they see what's happening. The detailed per-client view is usually kept at the leadership level. Article #12 → covers the decision rights side of this.
How often should I read it?
Operating P&L: once a month, structured 30-minute review. The statutory version: when the accountant produces it, usually monthly with quarterly more formal closes. Quick reads can be weekly during the monthly close cycle.
What's the difference between this and a "management report"?
A "management report" is usually a more frequent or segmented version of a P&L — useful, but often still incomplete (missing forward views, missing contribution margin segmentation, missing trajectory analysis). A true operating P&L is one component of a full management accounting practice, alongside payment calendar, financial model, and dashboard. Anchor article #1 covers the four core artifacts →
Should the owner's salary be on the P&L?
Yes, absolutely — as a separate, clearly identified line in Operating Expenses. If it's hidden as a "dividend" or "owner draw" that doesn't appear on the P&L, the operating margin is overstated. The business looks more profitable than it actually is. Article #10 — Owner Dividends — covers this distinction.
My business is small. Do I really need a segmented P&L?
The threshold is around two clients or two service lines — past that, segmentation starts paying off. Below that, an aggregate P&L tells the whole story because there are no segments to compare. Article #9 — Financial Management for a Small Business → addresses the size threshold.
Any questions left?
We are ready to answer them.

Finmap support