Table of Contents
Home
/
Blog
/
Five Outlets, Five Managers, Five Sets of Numbers: How the Franchise Owner Finally Saw the Whole Business

310

5 min

02.07.2026
Five Outlets, Five Managers, Five Sets of Numbers: How the Franchise Owner Finally Saw the Whole Business
.avif)
Oleksandr Solovei
CEO & Co-founder Finmap
"Each outlet manager sent me a weekly summary. Each was accurate. And I still had no way to know which outlet was actually the strongest, because I was reading five different formats and doing the math in my head."
An owner of a five-outlet retail franchise — home goods, ₴48M annual group revenue, one owner-operated flagship and four managed outlets — described the exercise that changed how she ran the business.
Each outlet used the same POS system. Each outlet had a manager. Each manager sent her a weekly summary — in a format the manager had chosen at some point over the years. Manager 1 sent Excel with 12 rows. Manager 2 sent a PDF export from the POS. Manager 3 sent a WhatsApp message with three numbers. Manager 4 sent a shared Google Sheet. Manager 5 sent a paper printout brought over on Fridays.
Every Monday morning she spent 90 minutes converting these five documents into her own consolidated spreadsheet. Not because the underlying numbers were wrong. Because there was no shared format, no shared cadence, no shared definitions of what "revenue" meant (some counted VAT, some didn't; some counted refunds pre-tax, some post-tax).
The exercise: build a single consolidated financial view for all five outlets without forcing anyone to migrate their bookkeeping from 1C. Four weeks, no software rewrite, no manager rebellion.
Why Franchise Consolidation Is Different From Ordinary Multi-Location
Multi-location businesses (a chain the owner operates directly) usually have one bookkeeping stack. Franchise-like operations — even when technically one legal entity — often have five different practices, five different tempo, five different definitions.
The obstacle isn't technical. It's political. Asking a manager to change how they keep records feels like a criticism of them. Most managers respond by resisting or by malicious compliance (following the letter but not the spirit).
The rebuild she did worked because it changed the format the owner received, not the practice the manager followed.
The Framework (Four Weeks, No Migration)
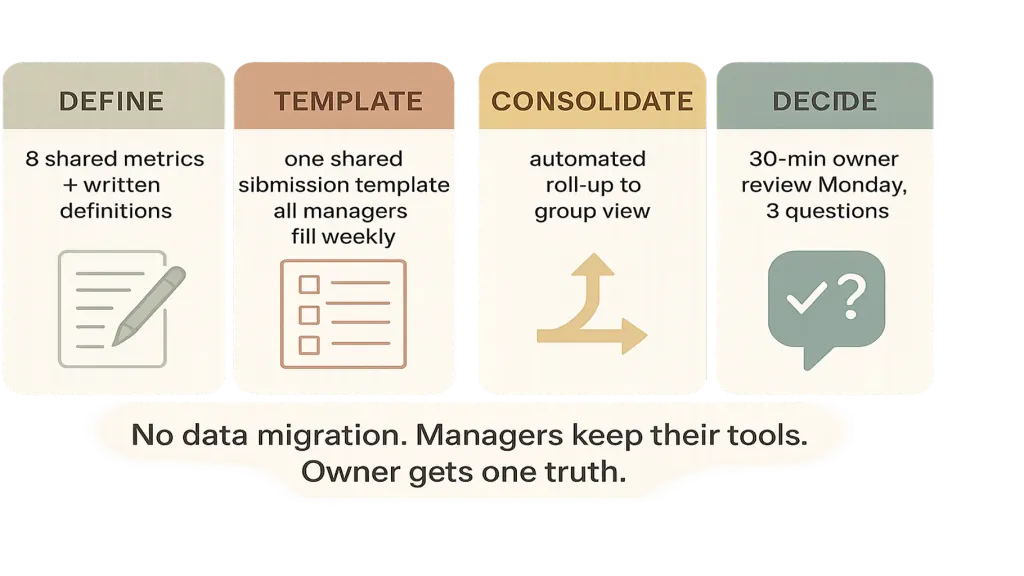
Week 2 — Template. A single shared submission template (spreadsheet or form). Each manager fills 8 numbers weekly. Format is fixed; source can be whatever they use (1C export, POS report, manual entry). One-hour training call with each manager, one-on-one, framed as "so I can help you faster" rather than "so I can watch you closer."
Week 3 — Consolidate. Owner's bookkeeper builds one consolidated view — either a spreadsheet with formulas linking the 5 templates, or a lightweight platform doing the roll-up. Not analytics; just aggregation with per-outlet breakdown. First consolidated view generated by week 3 Friday.
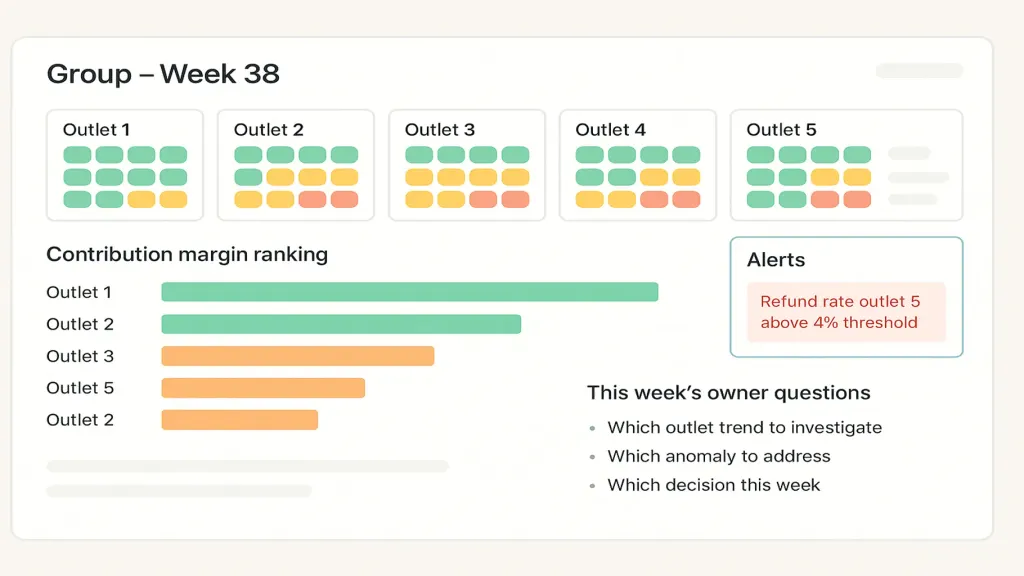
Week 4 — Decide. Owner's weekly ritual becomes 30 minutes on Monday: look at the consolidated view, answer three questions (which outlet trended, which anomaly to investigate, which decision needed). The 90 minutes of manual conversion disappears.
What She Saw the First Month
Once she had the consolidated view, three insights surfaced within four weeks.
One — outlet #3 wasn't her strongest, despite everyone believing it was. #3 had the highest gross revenue. But contribution margin was second-lowest because rent-to-revenue ratio was worst. #1 (her flagship) and #4 (a manager she'd underestimated) were actually the top contributors.
Two — refund practices differed dramatically. #2 refunded at 2.1% of gross; #5 at 4.8%. Investigation revealed #5's manager was too generous, and it was structurally costing the group ₴180K/year.
Three — one outlet had a cash-vs-book anomaly. Reported revenue and POS totals matched. Bank deposits didn't. Investigation revealed cash-handling gaps at one location — not fraud, but process weakness that was recovered through a new deposit procedure.
Total profit uplift in six months from the three insights alone: ₴420K annualized. All of it was in the data every week. She just couldn't see it while spending 90 minutes converting formats.
The Ongoing System
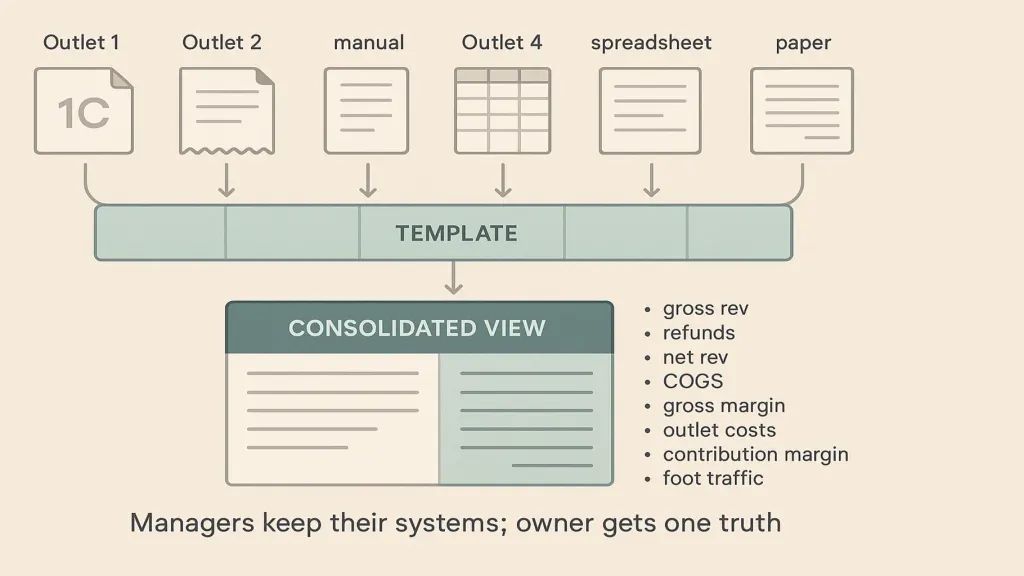
Six numbers on Monday, per outlet, plus five extras. Gross revenue, refunds, net revenue, COGS, gross margin, direct outlet costs, contribution margin, and (optional) foot traffic, average basket, employee count, hours worked, inventory-on-hand.
A shared weekly cadence. Sunday close, Monday morning submission, Monday afternoon owner review. The rhythm creates predictability that both owner and manager start to rely on.
Written definitions that don't change. If "revenue" means one thing this month and another next month, comparisons break. Once definitions are locked, they stay locked for at least a year.
📌 Do you run several outlets or entities and spend hours reconciling different formats? Send us a description of what each unit produces and we'll design a lightweight shared submission format and consolidation view for your group. Request your free Finmap diagnostic →
Read also
Share valuable content — become a source of insights




Frequently Asked Questions
Does this replace 1C or QuickBooks or the bookkeeper?

No. It runs alongside. Managers keep whatever they use; the shared layer is just aggregation.
What if a manager refuses to fill the template?
Frame it as help, not control. Offer to spend the first week filling it with them. Most resistance evaporates once the manager sees the owner reviewing outlet data more predictably (and less randomly).
Can this work for a franchise where outlets are separate legal entities?
Yes — even better, because the shared layer doesn't touch the legal/tax structure. Franchisees or partners keep independence; the owner-operator gets group visibility.
Spreadsheet or platform?
Spreadsheet works for 3–8 outlets. Above 8, a lightweight platform pays back in owner time saved.
Should the shared metrics include employee-level data?
Only if the outlets are similar enough that comparison is fair. If one is a flagship with 15 staff and another is a kiosk with 2, employee-level KPIs invite bad comparisons.
How often to update the framework?
Once a year for definitions. Quarterly for the metrics list. Weekly for the numbers themselves.
Any questions left?
We are ready to answer them.


Finmap support