Table of Contents
248
11 min
25.06.2026
Management Accounting for an IT Agency: The Three Numbers That Tell You Everything
Oleksiy Bazyura
Financial Expert at Finmap
"₴12M in annual revenue. 15 developers. Three years profitable. And I genuinely could not tell you, when asked, which project was profitable and which was a slow leak."
An IT services agency founder described the moment of realization at a leadership offsite. Her business had grown for three years. Revenue from ₴4M to ₴12M. Headcount from 5 to 15 developers. Profit visible at year-end. By every external measure — successful.
Then the COO asked a question: "Of our 11 active projects, which two are most profitable per developer hour?"
She couldn't answer. The accounting books showed revenue per project (sometimes — when projects were billed cleanly). They didn't show developer hours allocated per project. They didn't show effective hourly rate after subtracting downtime, holidays, internal work. They didn't show contribution margin per project type (T&M vs fixed-fee vs retainer).
She knew her aggregate margin was healthy. She didn't know which clients were generating it and which were silently subsidizing the agency's growth from her own margin.
This article is about the three numbers that an IT agency owner needs to make sense of her business — and why standard bookkeeping doesn't produce them, no matter how diligent the accountant.
The Paradox: ₴12M in Revenue Doesn't Mean ₴12M of Decisions
Most agency owners pay attention to two numbers: revenue and net profit. These are the numbers their accountant produces, the numbers they quote when introducing the business, the numbers they watch month over month.
These two numbers are too aggregate to drive decisions. An IT agency with ₴12M revenue and 18% net margin (₴2.16M profit) looks healthy. But:
- If 60% of the revenue is from two clients, the business has a hidden concentration risk
- If the most profitable project is delivering 38% margin and the least is delivering −4%, the aggregate hides both an opportunity (more of the profitable kind) and a problem (the loss-maker)
- If developer utilization sits at 58% but the project list looks "fully staffed," there's ₴1.4M of unrealized billable capacity each year
- If the team is being pulled off paid client work onto unpaid internal work 20% of the time, the effective hourly rate is dramatically lower than the published one
The aggregate numbers say "you're profitable." The decisions need to know "where, with whom, on what, and how durably." Management accounting for an IT agency is structured specifically to answer that.
The general framework — management accounting as a discipline — is in the anchor article → Management Accounting Explained.
The Three Numbers IT Agency Management Accounting Produces
For an IT services agency, three numbers do most of the decision-driving work.
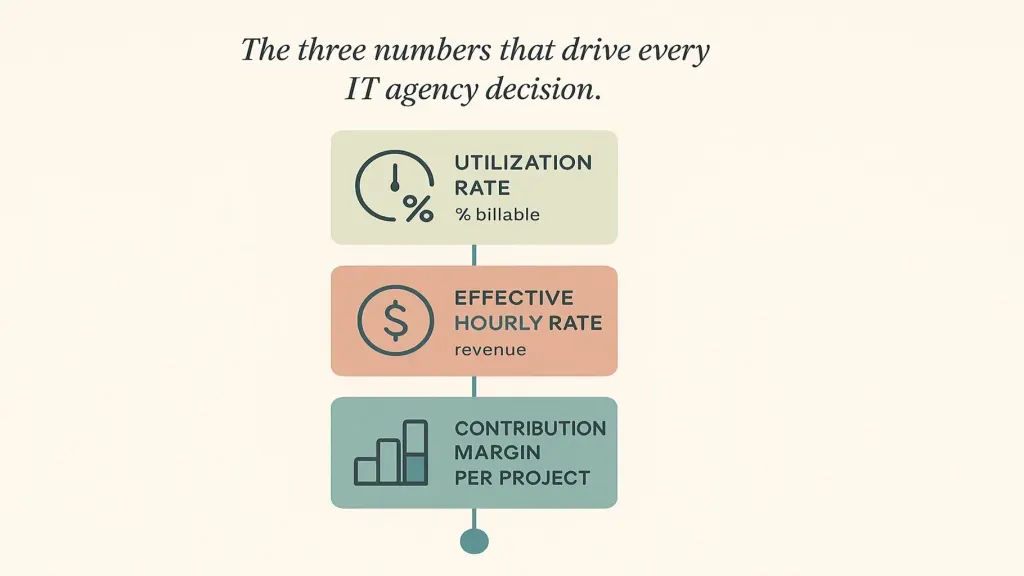
Number two — Effective hourly rate per project. Published rates are aspirational ("our senior dev rate is ₴1,800/hour"). Effective rates are what actually happens after scope creep, bench discounts to keep developers busy, internal hours not billed, and project rework. For a healthy IT agency, effective rate is 75–90% of published. Below 70% means underpricing or scope leakage. Computed per project, this number tells you which projects are reliably profitable and which silently drift.
Number three — Contribution margin per project (and per project type). Revenue minus direct delivery costs (developer time at fully-loaded cost, subcontractors, tools assigned to the project) before allocated overhead. Calculated per project, this is the most important strategic signal: it says which work is worth pursuing more of, which work to reprice, which clients to deepen, which clients to fire.
These three numbers don't appear on a tax-formatted P&L. They emerge from layering management accounting on top of clean bookkeeping plus time tracking. Article #2 → covers the bookkeeping-vs-management distinction; article #4 → covers the operating P&L this connects to.
How Those Numbers Change Pricing, Hiring, and Client Mix
When the three numbers exist, four kinds of decisions become structured rather than instinctive.
Pricing. Instead of "let's keep the same rates because clients haven't pushed back," pricing becomes: "our effective rate on this client is 67% of published — we're losing 33 points to scope leakage. Either tighten scope or raise the rate by 30%." Specific. Defensible.
Hiring. Instead of "we feel busy, let's hire another developer," hiring becomes: "utilization across the team has been at 76% for three months, projected to stay there given pipeline. One additional senior would absorb 65% utilization right away and reach 75% by month three. Affordable in the base case, tight in the downside." Modeled. Justifiable. Article #5 → covers the financial model that makes these scenarios runnable.
Client mix. Instead of "all clients are roughly similar," client mix becomes managed: drop the two clients delivering negative contribution margin, deepen the three delivering above-average margin, propose a rate adjustment to the two clients in the middle whose effective rate is silently below threshold.
Service line decisions. When contribution margin is measured per project type (fixed-fee dev work vs T&M vs ongoing retainer), the agency learns which models are most profitable and shifts the sales mix accordingly. Many agencies discover their lowest-margin work is the work they most enjoyed historically — and act on that.
The IT-Specific Complications
A few IT agency realities make management accounting harder than for other service businesses — and more valuable when done.
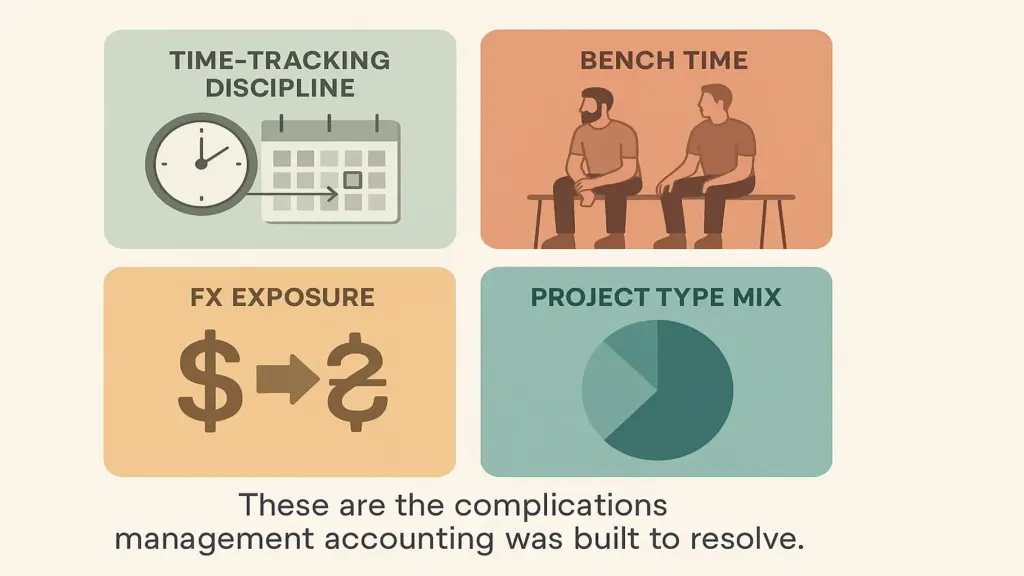
Bench time. Between projects, developers cost the agency without billing. This isn't dead capital — it's preparation, training, sales support. But it must be tracked and budgeted. A healthy agency runs ~10–15% bench time. Above 25% is a sales pipeline problem, not a delivery problem.
FX exposure. Many Ukrainian IT agencies bill USD or EUR while paying UAH. Exchange rate movements affect margin. Management accounting that converts everything to a single reporting currency at the right rates surfaces real margin — and reveals when FX is the explanation for a margin shift, not operational change.
Project type mix. Fixed-fee, T&M (time and materials), retainer, dedicated team — each has different margin dynamics, different risk, different cash flow timing. Aggregating revenue across all types hides which models are growing share and which are shrinking margin.
How to Install Management Accounting in 90 Days
The agency owner from the opening did this over a quarter. Three phases.
Phase 1 — Foundation (weeks 1–4). Install time tracking. Categorize all developer hours into: billable to specific client/project, internal (sales support, training, tools), bench (between projects), administrative. Get every developer logging hours consistently. The first month of data is incomplete — that's expected.
Phase 2 — Mapping (weeks 5–8). Map every active project: revenue, expected end date, fully-loaded developer cost (salary + benefits + overhead allocation), direct costs (subcontractors, tools). Calculate contribution margin per project for the previous quarter. The numbers will surprise. Article #4 → covers the operating P&L this connects to.
Phase 3 — Decision integration (weeks 9–12). With three months of utilization data and contribution margin per project, the owner runs three decisions: (1) one client to reprice, (2) one client to drop, (3) one hiring decision modeled against three scenarios. After these decisions, the practice is established. Monthly cadence takes over.
Article #12 → covers the cadence framework.
📌 See how management accounting looks for an IT services agency — utilization, effective rate, contribution margin per project — in one integrated view. Book a 20-minute Finmap demo. We'll walk through a real example agency setup and show how the three numbers surface decisions. Book a Finmap demo →
Topic foundation: Management Accounting Explained: What It Is and Why Owners Need It
Industry: How Finmap Helps IT Companies Bring Order to Their Financial Management
Share valuable content — become a source of insights


Frequently Asked Questions
Do I need a specific platform for IT agency management accounting?
Helpful but not required. The basics — utilization, effective rate, contribution margin per project — can be built in spreadsheets if time tracking exists. Most agencies migrate to a platform after 6–9 months because the manual maintenance becomes a part-time job. Article #3 → covers the platform option.
My agency is small (3–5 devs). Is this overkill?
The smaller the agency, the more concentrated the risk of one bad project. A 3-dev agency where one project is delivering −20% margin is bleeding 30%+ of one developer's productive output. The simpler version of these three metrics is essential, not optional, at this scale.
How does this relate to the bookkeeper?
The bookkeeper still handles compliance, tax, payroll. Management accounting sits on top — using time tracking + accounting data to produce the three metrics. Article #2 — Bookkeeping vs Management Accounting →
Should I share utilization data with developers?
A summary, usually yes. Developers respond well to clarity about where the business stands. Specific utilization numbers should be discussed structurally (in 1:1s, in team retrospectives), not as ambient surveillance.
What if we're FX-exposed (USD clients, UAH costs)?
Convert everything to a single reporting currency at the rate of the period, then track FX impact as a separate line. This isolates "operational" margin from "FX" margin — and reveals when one is masking the other.
How long until I see the value?
The first month of data reveals the loudest signals — usually 1–2 clients or projects that needed repricing. By month three, the pattern is fully visible and decisions become structured. By month six, it's part of how the agency runs.
Any questions left?
We are ready to answer them.

Finmap support