Recipe & Food Cost Calculator
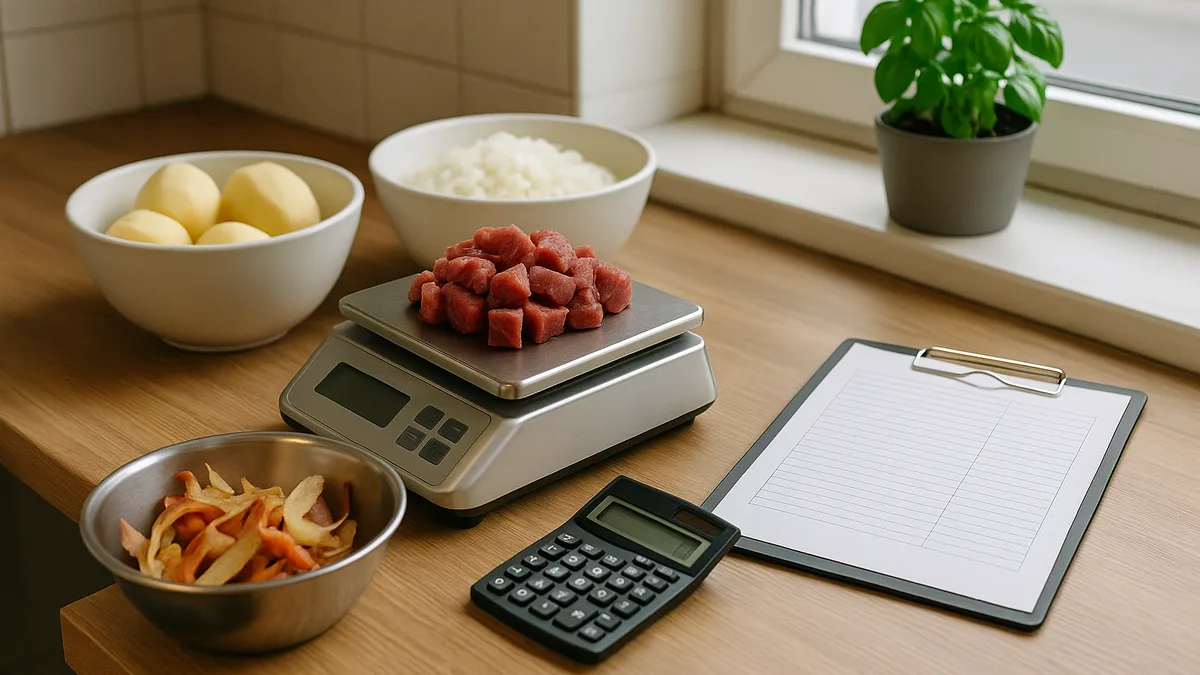
Food cost is not the price of the ingredients. It is the price of the ingredients you buy divided by the part of them that reaches the plate, plus the portions that never get sold — and that difference is where most kitchen margins go.
The first sheet costs one dish. Each ingredient carries a pack price, a pack size and a usable share: beef chuck at 82%, potatoes at 75%, onion and carrot at 80%. The sheet turns those into an effective cost per gram, so the trimming is paid for by the portion that sells rather than quietly ignored. In the sample that waste adds 20.42 to a plate that would otherwise cost 119.66.
An allowance for comps and remakes — 4% here — turns the ingredient cost into a loaded cost of 145.68. Against a 30% target that implies a menu price of 485.60; against the actual price of 440 it gives a food cost share of 33.1% and a contribution of 294.32 per portion. The sheet also prices the next supplier increase: a 10% rise across all ingredients moves this dish to 36.4% and takes 14.57 off every plate.
The second sheet is the one that changes decisions. It takes each dish with what it actually sells and weights the food cost properly: 28% across the menu, not the simple average of the percentages, which would be a different and wrong number. More usefully, it separates percentage from cash — the dish with the lowest food cost percentage on the sample menu is not the one producing the largest contribution.
That distinction is the whole point of costing a menu rather than a recipe. Percentages do not pay rent; contribution per month does, and it depends as much on what sells as on what it costs. Finmap connects those sales to the purchase invoices behind them, so the costing can be refreshed when prices move instead of once a year when someone remembers.