Table of Contents
Home
/
Blog
/
The Report Said 30% Margin. The Bank Said Otherwise. Here's Where E-commerce Margin Actually Goes.

369

5 min

02.07.2026
The Report Said 30% Margin. The Bank Said Otherwise. Here's Where E-commerce Margin Actually Goes.

Karine Shevchenko
Financial Expert at Finmap
"Every product page said 30% gross margin. Every month, my bank account said 8%. It took three months to find the 22 points that disappeared between the two — and they weren't hiding, we just weren't looking."
An owner of a mid-sized clothing brand — ₴14M annual revenue, three sales channels (own site, two marketplaces), no physical retail — described the audit that changed how she reads her P&L.
Her product margin math was correct. Cost of goods per SKU averaged 42% of retail. That left 58% gross margin. Subtract 28% for the "usual" operating costs — marketing, salaries, rent for a small fulfillment space — and the model said 30% net. Every product decision had been made on that math for two years.
Actual net margin, once the full picture was reconstructed: 8%.
The 22 missing points were not in one place. They were distributed across five leaks that individually looked minor and cumulatively ate two-thirds of expected profit.
The Five Leak Points
The audit — done over a weekend and a Monday with her bookkeeper — traced revenue and cost month by month for the previous six months. Each of the five leaks was quantified.
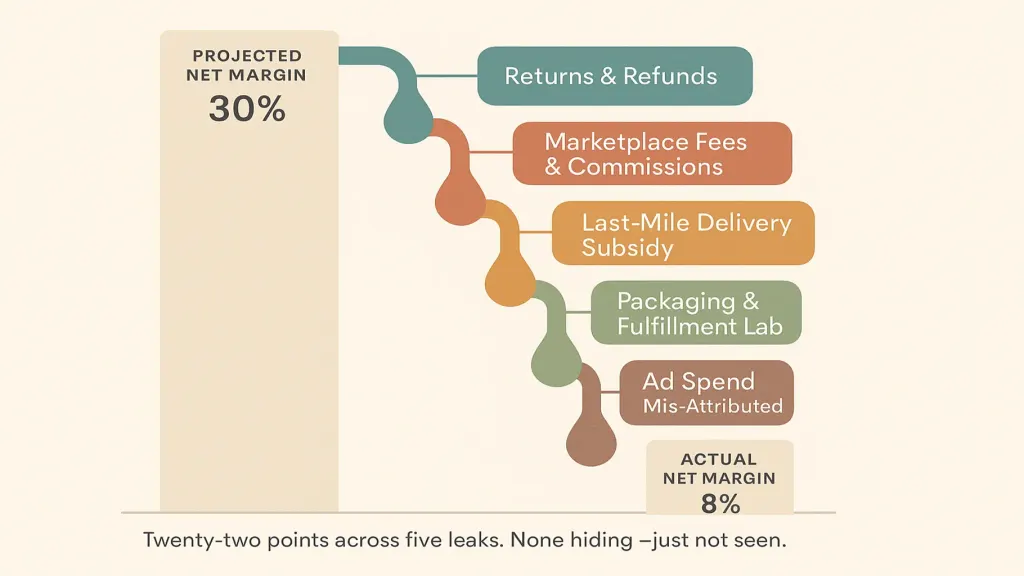
Leak two — marketplace fees and commissions (−5 points). Marketplace commissions of 15–18% were tracked. What wasn't: payment processing on top, promotional fees for placement, and the fee on returned orders that the platform kept. Total marketplace channel cost was closer to 22% of gross revenue on those channels.
Leak three — last-mile delivery subsidy (−4 points). Her site offered "free delivery over ₴800" to compete. Average delivery cost per order: ₴95. The subsidy averaged ₴58 per free-delivery order across her order mix. Applied across half her volume, another −4 points.
Leak four — packaging and fulfillment labor (−3 points). Padded envelopes, tape, labels, filler, thermal labels, thank-you cards, plus one-third of a full-time fulfillment person's time attributed to picking and packing. Sitting inside "operating costs" as a single line, invisible per-unit.
Leak five — ad spend booked as generic "marketing" (−4 points). She spent ₴180K/month on paid social and search. Attributed on the P&L to marketing. Not attributed per product line or per marketplace, so the low-margin SKUs and low-margin channels were being subsidized by high-margin ones without her knowing.
How She Fixed Each One
The response wasn't to cut everything. It was to see each leak clearly and decide, per leak, whether it was strategic, fixable, or wasteful.
- Returns: installed a size-guide overhaul and a fitting-video for each SKU. Six months later, return rate fell from 12% to 7.5%. Net recovery: +3 points.
- Marketplace fees: dropped the lowest-performing marketplace (the one with the highest total cost and lowest incremental sales). Consolidated ad spend onto own-site direct. Net recovery: +2 points.
- Delivery subsidy: raised the free-delivery threshold from ₴800 to ₴1,200. Average order value went up (customers added to reach threshold). Fewer subsidized orders. Net recovery: +2 points.
- Packaging & labor: renegotiated packaging supplier for larger volume, redesigned pack station for efficiency. Net recovery: +1.5 points.
- Ad spend attribution: re-cut spend by SKU and channel. Killed two SKUs that were structurally unprofitable at scale. Reallocated to the best margin SKUs. Net recovery: +3 points.
The rebuild lifted net margin from 8% to 19%. Not the projected 30% — some of the drops were structural (marketplace fees, delivery expectations) and couldn't be eliminated without breaking the model. But 19% is a business with room to invest in growth. 8% is a business one bad month away from crisis.
The Framework You Can Use
The audit reproduces in any e-commerce business. It takes 8–12 hours of focused work.
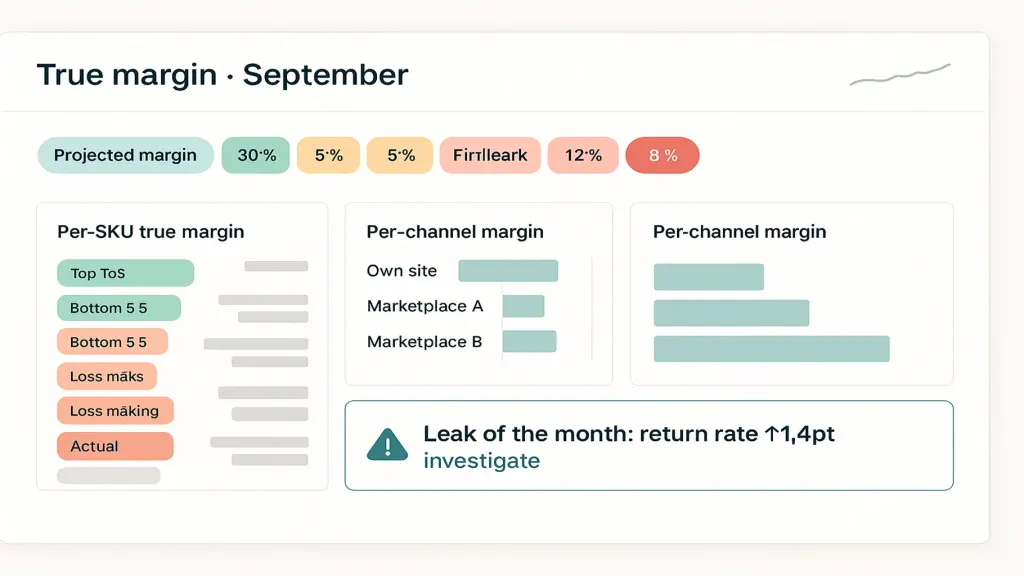
Step two. Compute true net per SKU. Retail − COGS − marketplace fee − delivery subsidy per order − packaging per order − return allocation per order − ad spend allocated by SKU.
Step three. Rank SKUs by true net margin. Identify the bottom quartile. Decide per SKU: kill, reprice, redesign, or accept.
Step four. Rank channels by true net margin. Identify the channel where ad spend is being wasted. Reallocate.
Step five. Set up a monthly review of the same numbers so the leaks stay visible.
📌 Want to see where the margin is actually leaking in your e-commerce business? Send us three months of orders and channel data — we'll build the per-SKU true-margin waterfall and walk you through it in 15 minutes. Request your free Finmap diagnostic →
Read also
- How Finmap Helps Retail Businesses Establish Financial Order
- Sales ≠ Profit: How to Stop Margin Bleed in 10 Minutes a Day
Topic foundation: Unit Economics for a Small Business: Do You Actually Make Money on Each Sale?
Share valuable content — become a source of insights





Frequently Asked Questions
How much of the 22 points is universal for e-commerce and how much was specific to me?

The categories are universal — returns, marketplace fees, delivery subsidy, packaging/labor, ad attribution — but the magnitude varies. Fashion has higher returns. Home goods have higher packaging. Every business needs the audit to know its own numbers.
Should I do this per SKU or per category?
Per SKU if you have under 200. Per category if more. Per SKU gets you sharper decisions; per category is faster to maintain.
Can I trust the marketplace's own dashboard for my true margin?
No. Marketplaces show gross margin at the SKU level. They don't show your full-cost margin, and they have no incentive to make their fees look large.
My accountant doesn't do this. Do I need a different accountant?
Not necessarily. Ask them to produce a per-SKU cost breakdown. If they can't, hire a bookkeeper or use a platform that automates it.
Spreadsheet or platform?
Spreadsheet works for 8–12 hours of audit. For ongoing monthly review of 100+ SKUs, a platform is dramatically less painful.
How often should I re-audit?
Once quarterly for full audit. Monthly for the leak indicators (return rate, average delivery subsidy, per-channel margin) to catch drift.
Any questions left?
We are ready to answer them.


Finmap support