Table of Contents

246

5 min

02.07.2026
20 Developers, an Hourly Rate, and No Idea What the Project Actually Made

Oleksiy Bazyura
Financial Expert at Finmap
"I knew every developer's hourly rate. I knew the client's contract rate. I subtracted one from the other and thought I knew the margin. Then I built a per-project P&L and realized I'd been running a business on a fiction for four years."
A founder of a services-and-outstaff IT company — 20 developers, ₴36M annual revenue, seven active clients — described the exercise that changed how she priced work and hired.
For four years she had run the business on what everyone in the industry runs on: hourly rate math. Each developer had a cost rate (₴550/hour, on average). Each client had a contract rate (₴950/hour, average across clients). Simple subtraction said ₴400/hour gross margin per developer, ~42% margin. Extrapolated across the team: comfortable, profitable, growing.
Then she did the exercise. Take one project. Not the "we billed the client ₴X per hour" number. The actual project P&L. Client revenue for the month. All costs directly attributable to that project. All costs indirectly attributable. What's left.
Project margin on her flagship client, over the previous 12 months: 14%. Not 42%.
Twenty-eight points of margin had disappeared into a set of costs the hourly rate math didn't touch.
What the Hourly Rate Math Actually Hides
The hourly rate assumes a developer is 100% utilized on the project, 100% productive during that time, and the project consumes only their labor. None of those are true for any real services business.
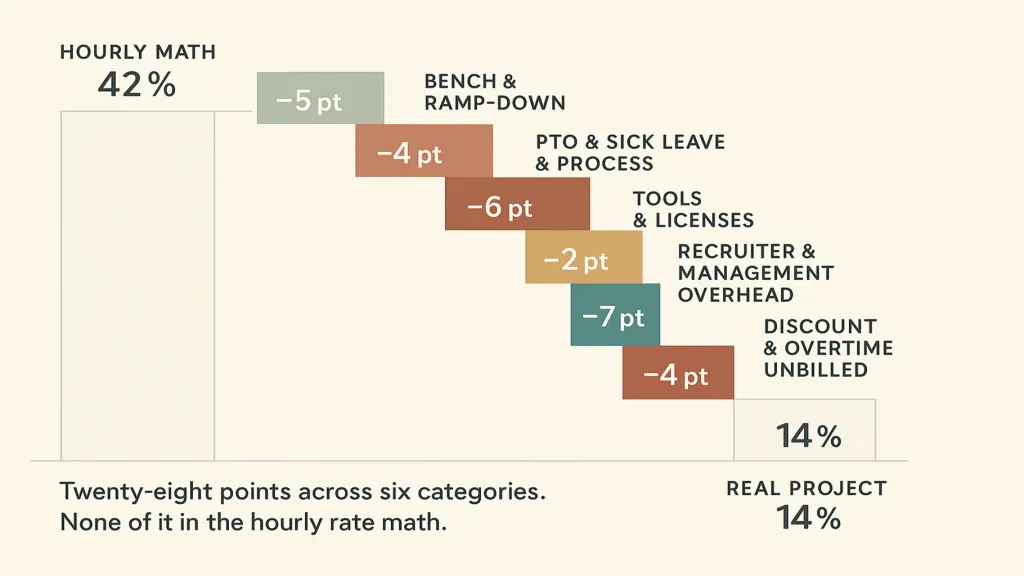
PTO and sick leave (−4 points). Salaried developers get paid vacation and sick time. Contract rate is billed only when they work. The gap is invisible until you count.
Internal meetings, process, hiring interviews (−6 points). Standups, retros, planning, interviewing candidates, internal syncs. All paid, none billable. On average 4–6 hours per developer per week.
Tools and licenses (−2 points). IDE licenses, cloud infrastructure for internal environments, project management tools, monitoring, communication platforms. Small per unit; adds up.
Recruiter and management overhead (−7 points). HR, delivery managers, project managers, the founder's own time. All get paid. Almost never billable. This was the biggest single leak.
Discount and overtime unbilled (−4 points). Client pushed back on rate at renewal, granted 8% discount. Emergency work done on weekends not always tracked. Overrun on fixed-scope portions absorbed.
Twenty-eight points, six categories, none in the hourly rate math.
The Rebuild — Project P&L Framework
The founder built her per-project P&L over a weekend. It became the single most important document in her business. Framework applies to any services company.
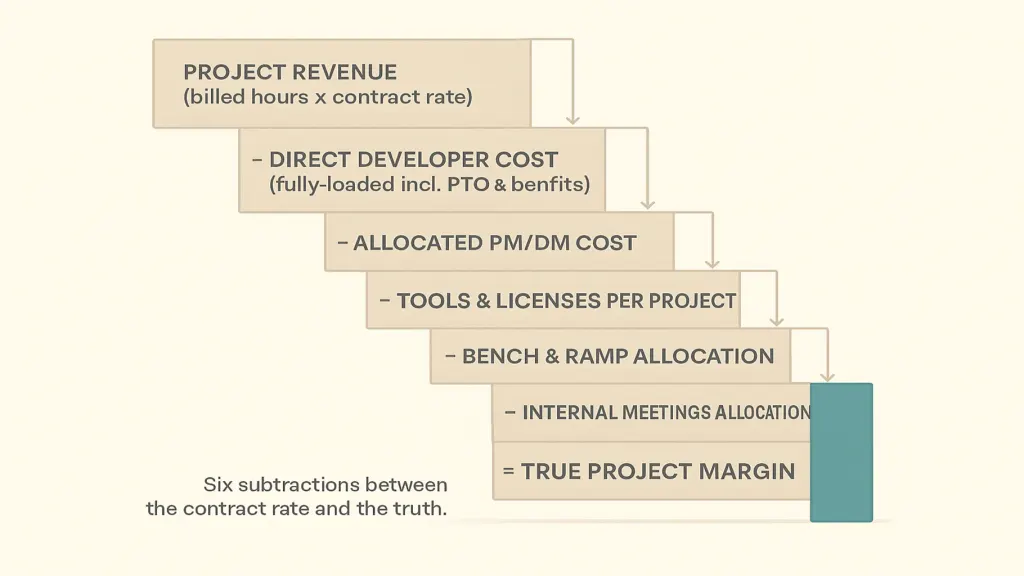
Two — Direct developer cost, fully loaded. Salary + taxes + benefits + equipment amortization + paid time off, divided by utilization hours (not calendar hours). If a developer is billable 65% of the time, their fully-loaded hourly cost is salary/(hours × 0.65).
Three — Allocated project management, delivery management, and recruitment cost. Rough share by project size or by revenue. Doesn't need to be perfect. Needs to be consistent.
Four — Tools and licenses attributable to the project.
Five — Bench allocation. Total bench cost for the year, divided across active projects.
Six — Internal meetings and process allocation. Percentage of paid hours going to non-project work × allocated cost.
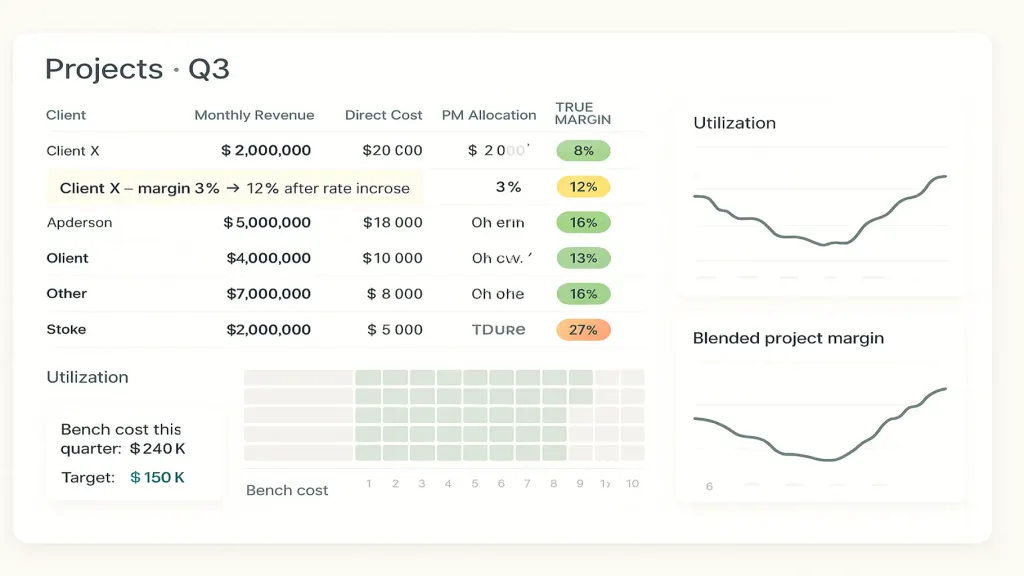
Result — True project margin. For her flagship client: 14%. For two smaller clients: 21% and 8%. For one client she thought was her best: 3%.
What She Did With the Truth
The 3% client got a rate increase conversation. It went well; margin went to 12%. The 8% client had scope discipline problems (over-serving) that were fixable; margin went to 15%. Recruitment overhead was renegotiated with a fixed monthly retainer instead of per-hire fees. Internal meetings were audited — three weekly recurring meetings were killed. Utilization for two of her senior developers went from 58% to 72% by moving them off bench-heavy internal work onto client work.
The Framework — What to Track
Six numbers, monthly, per project:
- True billable hours (not committed hours; actual)
- Fully-loaded developer cost per project
- Allocated management overhead (PM/DM/recruiter/founder time as % of month)
- Bench allocation (this month's bench cost × project's revenue share)
- Project true margin (revenue − everything above)
- Utilization per developer, tracked separately from margin
Six numbers, one dashboard, monthly review with the delivery lead. Two hours a month, keeps the fiction from returning.
📌 Want to see whether your projects are actually as profitable as your hourly rate math suggests? Send us three months of billing data and team cost breakdown — we'll build the per-project true-margin waterfall and walk you through it in 15 minutes. Request your free Finmap diagnostic →
Read also
- Management Accounting for an IT Agency: The Three Numbers That Tell You Everything
- How Finmap Helps IT Companies Bring Order to Their Financial Management
Topic foundation: Unit Economics for a Small Business: Do You Actually Make Money on Each Sale?
Share valuable content — become a source of insights






Frequently Asked Questions
Isn't utilization just a KPI, not a margin driver?

It's both. Higher utilization directly increases fully-loaded margin because developer cost is spread over more billable hours. Lower utilization silently kills margin.
What if a developer works on 3 projects in a month?
Allocate their time by actual hours worked on each. Their fully-loaded cost splits by same ratio. This is why time tracking, even lightweight, matters.
Should we track bench per developer or pooled?
Pooled is fine for smaller shops (under 30 developers). Above that, per-developer is cleaner because senior bench is much more expensive than junior bench.
Fixed-price projects — how does this apply?
Same math, but revenue is monthly earned portion (contract value × % complete). Loss projects surface much earlier this way than they do in cash accounting.
Client won't accept a rate increase. What now?
Test the alternative — is the project profitable enough to keep at current rates? If margin is negative or under 10%, look at scope reduction, delivery efficiency, or a graceful transition.
How is this different from what my accountant produces?
Your accountant produces company-level P&L. This is project-level P&L, which requires allocations the accountant usually doesn't have the operational data to make.
Any questions left?
We are ready to answer them.


Finmap support