Table of Contents
Home
/
Blog
/
The Medical Clinic Owner Who Didn't Know What "Revenue" Meant — Until She Separated Three Streams

346

5 min

02.07.2026
The Medical Clinic Owner Who Didn't Know What "Revenue" Meant — Until She Separated Three Streams

Julia Polinyak
Financial expert at Finmap
"My monthly report showed ₴820K revenue. My bank showed ₴410K received. My accountant said both were correct. I couldn't manage a clinic reading numbers that lived on three different calendars."
An owner of a mid-sized medical clinic — six specialists, 3 rooms, ₴9.8M annual revenue, four insurance-partner contracts plus cash-paying patients — described the month she stopped trusting her monthly P&L.
Her accountant produced a clean monthly summary. Revenue ₴820K, expenses ₴680K, net ₴140K. She had been growing steadily for two years and treating the report as truth.
Then a specialist told her she was "quietly working for free that quarter" because most of her patients that month were on the two insurance plans that paid 60 days later. The specialist meant it as a joke about her own cash flow. The owner realized it was true about the whole clinic.
Three revenue streams — cash-paying patients, insurance-A patients (fast pay), insurance-B patients (slow pay) — lived on three completely different cash calendars. The accountant's "revenue" was the accrual number, correct on paper. The clinic's "cash coming in" was different every month by a factor of 2 depending on the mix. She had never separated the streams.
Why Medical Clinic Revenue Is Different
Consumer businesses collect at point of sale. Services with invoicing collect within 14–30 days. Insurance-partnered medical clinics collect on schedules the clinic doesn't control — sometimes 30 days, often 60–90 days, occasionally with clawback for adjustments.
A "profitable month" on the P&L can be a cash-desert month at the bank. And because each insurance partner has different terms, the same patient count can produce wildly different cash timing depending on which partner referred them.
The rebuild the owner did separated three streams and rebuilt each with its own P&L logic and its own cash calendar.
The Three-Stream Framework
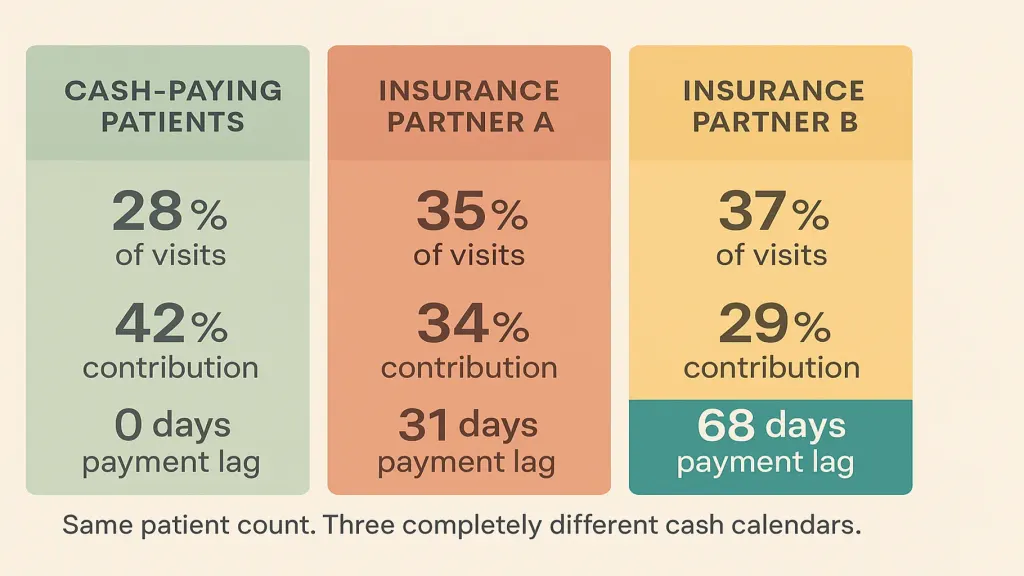
Stream 2 — Insurance Partner A (35% of visits). Revenue billed at visit, paid on average day 31 after visit. Contribution margin: 34% (contract rate is lower than cash rate).
Stream 3 — Insurance Partner B (37% of visits). Revenue billed at visit, paid on average day 68 after visit. Contribution margin: 29% (contract rate is lowest, occasional clawback).
The owner discovered that her single biggest partner (Partner B) was paying her the least per visit and slowest — but was also the largest volume driver. Killing it would drop her revenue 35%. Renegotiating was the leverage.
What She Learned By Separating the Streams
Insight one — the clinic wasn't as profitable as it looked, weighted by contribution margin. Volume-weighted contribution margin: 34%. Pure-cash margin: 42%. The insurance-mix cost her 8 points of margin she'd been attributing to "just how it is."
Insight two — cash timing was structurally fragile. On a month where Partner B billing spiked, real cash arriving was 6–8 weeks behind. The clinic had zero cash reserve to absorb that.
Insight three — one specialist was underutilized. Because insurance mix varied by specialist (some had older patient bases with Partner B; others had younger cash-paying patients), the utilization pattern varied. One specialist was working 26 hours per week; she'd been treating him as "just as productive." He was structurally cheaper per hour but generating less contribution.
What She Changed
Renegotiated Partner B. After collecting a year of data showing her specific patient mix, retention, and quality metrics, she asked for a rate increase and a 45-day cap on payment cycle. Got both, partially. Margin on that stream went from 29% to 33%.
Built a rolling cash reserve. Six weeks of fixed costs (specialist retainers, rent, receptionist, utilities). Took 11 months to build from cash-paying stream revenue.
Redirected marketing. Small paid-search push targeting a cash-paying demographic. Cash-paying share moved from 28% to 34% over 6 months, without total volume dropping.
Re-scheduled the underutilized specialist. Moved to a schedule that concentrated Partner B patients on 2 days per week rather than spread across 4. Specialist utilization on active days rose from 62% to 84%.
Twelve months later: contribution margin lifted from 34% to 37%; cash timing improved by 18 days average; six-week reserve established; overall profit up ~₴480K annualized.
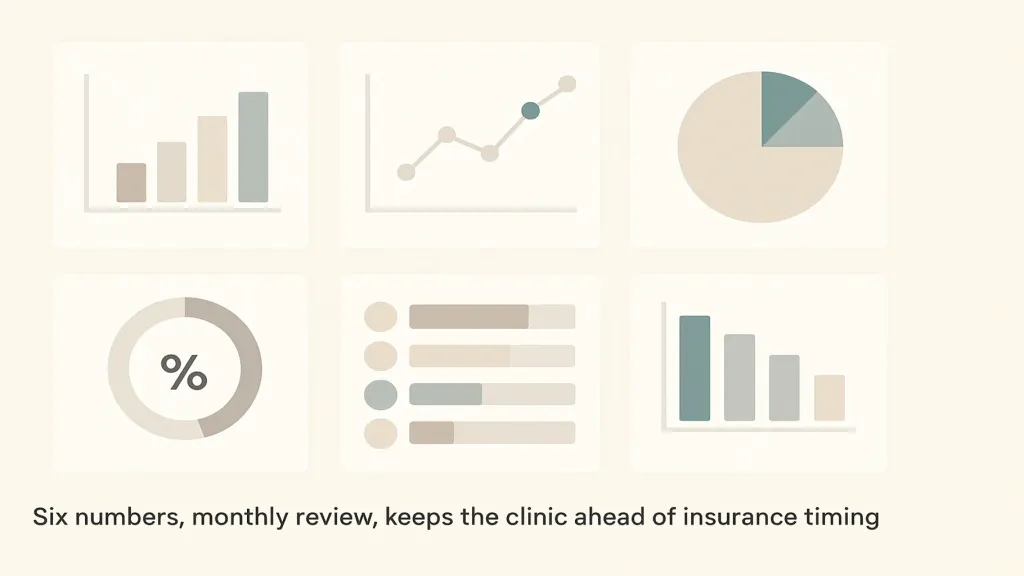
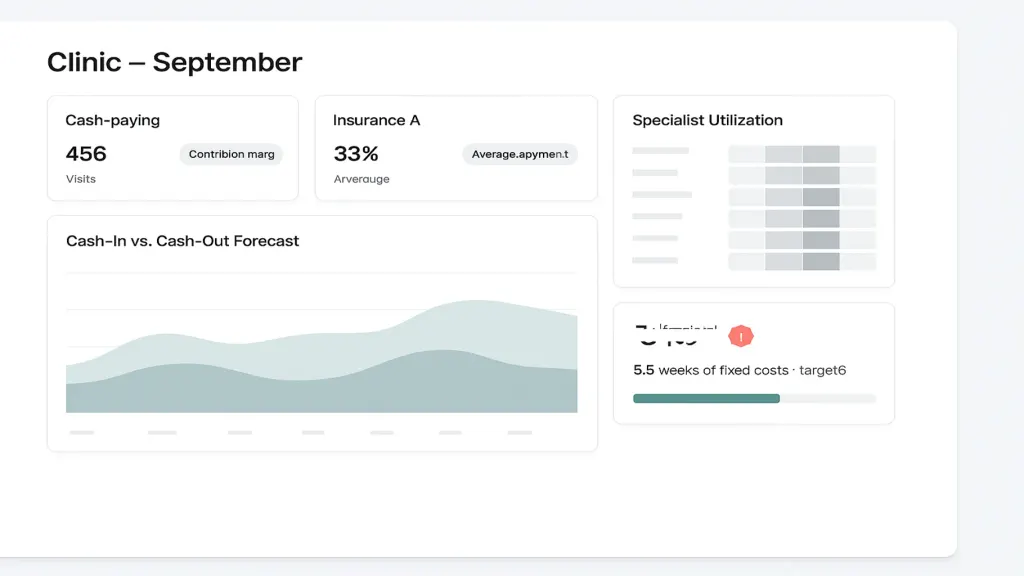
The Six Numbers You Actually Need
- Contribution margin per revenue stream
- Payment lag per stream (days from visit to cash received)
- Volume mix (% of visits per stream, monthly)
- Specialist utilization (hours worked vs available)
- Payment reliability per insurance partner (variance)
- Cash reserve as weeks of fixed cost
📌 Do you run a clinic where insurance partners pay on different cycles and profitability feels uncertain? Send us three months of visits by stream and payment-received data — we'll build the three-stream contribution and cash-timing view. Request your free Finmap diagnostic →
Read also
Share valuable content — become a source of insights





Frequently Asked Questions
Should I stop working with insurance partners with slow payment?

Only if you have replacement volume. In practice: renegotiate first, drop last. Volume is precious in medical.
What's a healthy reserve for a medical clinic?
Six to eight weeks of fixed costs (specialist retainers, rent, receptionist, utilities, software). Build from cash-paying stream and any surplus month.
How is this different from my accountant's monthly report?
Accountant produces accrual-based revenue. This produces stream-separated cash timing and contribution — the picture the owner actually needs to run the business.
Can a spreadsheet handle this?
Yes, for one location, up to about 8 specialists. Above that, or multi-location, a platform pays back.
Should specialists see stream data?
Yes, but framed as clinic-level not individual accountability. They already sense which insurance is slow; making it explicit helps rather than hurts.
How often to review?
Monthly for the six numbers. Weekly for the cash forecast if you don't yet have a healthy reserve.
Any questions left?
We are ready to answer them.


Finmap support