Table of Contents

955

5 min

08.07.2026
"Where Does My Money Go?" — How a Small Business Owner Sees the Answer Every Morning

Olena Smolikova
Financial expert at Finmap
"I couldn't tell you what my top three costs last month were. I could tell you my revenue. I could tell you my bank balance. But between those two numbers there was a fog — the whole middle of the business."
Every small business owner in Ukraine says a version of the same sentence in the third or fourth year of running the business: "I don't know where the money actually goes." Not in a dramatic sense — the business is profitable. In a specific sense — she can name her top clients, her top staff, her rent. She cannot name her top eight cost categories in order, and she can't tell you which one grew fastest over the last six months.
The gap between "I know my revenue" and "I know my spend" is where most small businesses lose the ability to make sharp decisions. Cutting the wrong thing in a panic. Adding a subscription that quietly stays for two years. Missing a supplier drift of 15% that would have been obvious if seen.
This article is about closing that gap — not by becoming a bookkeeper, but by installing a simple daily view of where money went yesterday, updated automatically.
Why This Problem Happens to Every Small Business
One — everything gets recorded, nothing gets summarised. Bank statements exist. Receipts exist. Invoices exist. But nowhere is there a single view that says "these were your top eight costs last month, and this one grew". Data without a view is invisible.
Two — categories drift. A "marketing" category that made sense in year one now includes freelancers, tools, ads, PR, events — five very different animals in one bucket. You can't see which one you're overspending on because they're merged.
Three — the accountant is optimised for the government, not you. Your accountant's reports are legally correct and operationally useless. They show the past for compliance. They don't show the drift you'd act on.
Four — memory is deceptive. Owners believe they remember what they spent on. In fact, they remember the emotional expenses (a big supplier bill, a big salary payment) and forget the accumulating small ones (dozens of small subscriptions, one-off consultants, delivery costs).
Five — you've stopped asking because you don't have a way to see. The question "where does my money go?" fades because there's no answer that arrives without work. Once there's a daily view, the question comes back — and useful decisions come with it.
How to Recognise You Have This Problem
- You can name your top clients but not your top eight spend categories.
- Someone in your team asks "should we still be paying for X?" and you're not sure what X actually costs.
- Every quarter, at least one subscription surprises you by renewing.
- Your monthly P&L looks normal but your bank balance feels tighter than it should.
- You've said "не знаю куди йдуть гроші" ("I don't know where the money goes") in the last two months.
Any of these — the framework below is the fix.
How to Solve It — The Daily-View Practice
Not a project. A practice. Two setup steps and one habit.
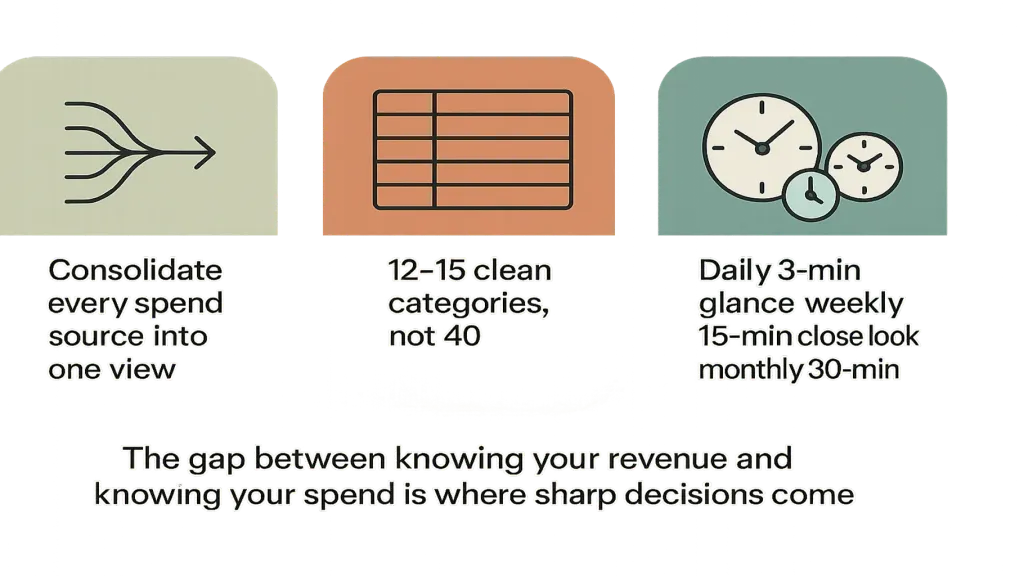
Step 1 — Consolidate every source into one place. Business bank accounts. Personal-but-used-for-business cards. USDT wallets used for business. Cash if you handle any. Every source of spend needs to flow into one categorised view. If it doesn't, the fog stays.
Step 2 — Set up 12–15 clean categories, not 40. Rent. Salaries. Salaries-adjacent (taxes, ЄСВ, benefits). Suppliers. Marketing (broken into 2-3 sub-categories if meaningful). Subscriptions. Professional services. Utilities. Office supplies. Delivery. Taxes. Owner's take. Twelve to fifteen is the sweet spot — few enough to eyeball, many enough to see drift.
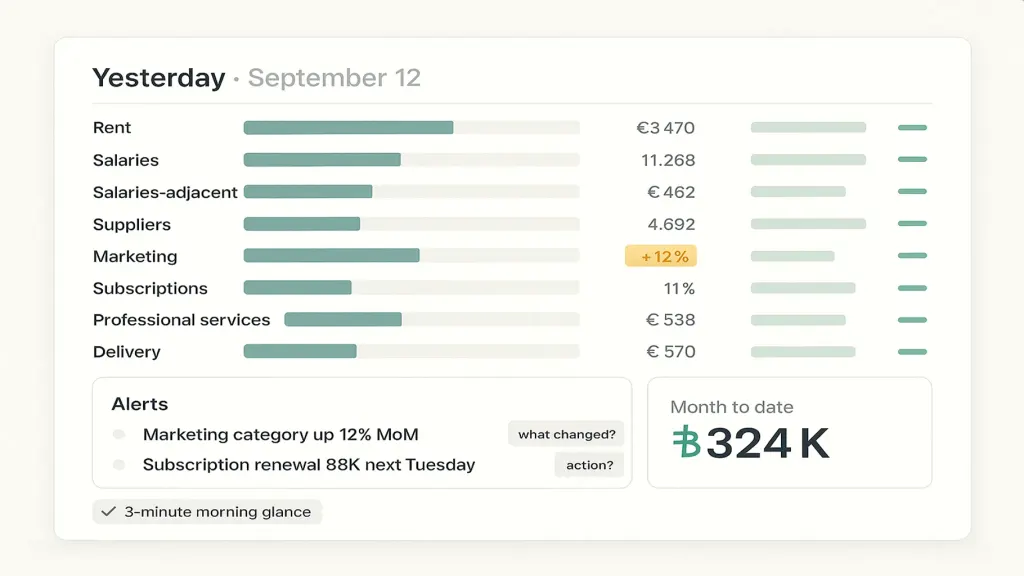
Step 3 — Look every morning. 3 minutes. Not to analyse. To notice. Yesterday's spend, categorised. Anything unusual jumps out. Month-to-date vs same period last month — is any category drifting? That's it.
Once per week (15 minutes) — a slightly closer look. Which category grew the most? Was that intentional? Anything to renegotiate or cancel?
Once per month (30 minutes) — the full month's breakdown vs previous months. What are the top 8? What moved? What surprised you?
Where AI Takes This Further
At three data sources and 12 categories, a spreadsheet works. At five sources, multi-currency, and dozens of subscriptions, the data gathering eats the time.
This is where a platform like Finmap changes the daily-view practice from a discipline into a habit. The platform connects directly to your banks, categorises every operation as it lands, and shows the full spend picture the moment you open it — no manual entry, no forgetting, no "все в Excel, але щось не вношу".
The AI layer inside Finmap adds the pattern-recognition step: it watches your categories over time and flags when something drifts unusually. Marketing up 30% two months in a row without a matching decision? Flagged. A supplier suddenly billing more frequently? Flagged. A subscription renewing at a higher price? Flagged. Not because AI is the point — because the platform's job is to answer "where does the money go?" faster than you can ask.
The Numbers Behind Finmap
- 18,000 business clients in 54 countries rely on Finmap.
- 97% of clients stay with Finmap for years — retention as evidence the tool actually delivers.
- PMF signal: 56% of users would be "very disappointed" if Finmap disappeared (product-market fit benchmark is 40%).
Three Common Mistakes
- Too many categories. Forty rows means nobody looks. Twelve to fifteen means the picture stays legible.
- Only looking monthly. Drift accumulates in weeks. Monthly is too slow to catch it before it costs money.
- Treating this as bookkeeping. It isn't. Bookkeeping serves the government. The daily view serves you. Different documents, different purposes.
📌 See yesterday's spend, categorised, this morning — free for 14 days, no card required. Start your free 14-day Finmap trial → finmap.online/ua
Знаєш що зараз. Бачиш що буде. Знаєш що робити.
Read also
Share valuable content — become a source of insights




Frequently Asked Questions
How is this different from a monthly P&L?

Monthly P&L is a summary. The daily view is a heartbeat. Both matter; they serve different rhythms.
Do I need to categorise every operation myself?
For the first month, yes — you'll teach the platform your categories. After that, most operations auto-categorise from patterns.
What if my accountant's categories are different from what I want to see?
Keep two views. The accountant's categories serve compliance. Your daily view serves decisions. They can coexist.
How much time does this actually take?
Setup: ~2 hours once. Daily: 3 minutes. Weekly: 15 minutes. Monthly: 30 minutes. Total: ~4 hours per month.
Does the daily view work if I have multiple entities (TOV + FOP)?
Yes — the practice is the same. The consolidation step just includes both entities.
Can my ops director see the same view?
Yes. Consider gating owner-take and salary details if not appropriate to share.
Any questions left?
We are ready to answer them.


Finmap support