Table of Contents

217

5 min

01.07.2026
Three Coffee Shops, One P&L, and the Location That Was Quietly Eating the Other Two

Julia Polinyak
Financial expert at Finmap
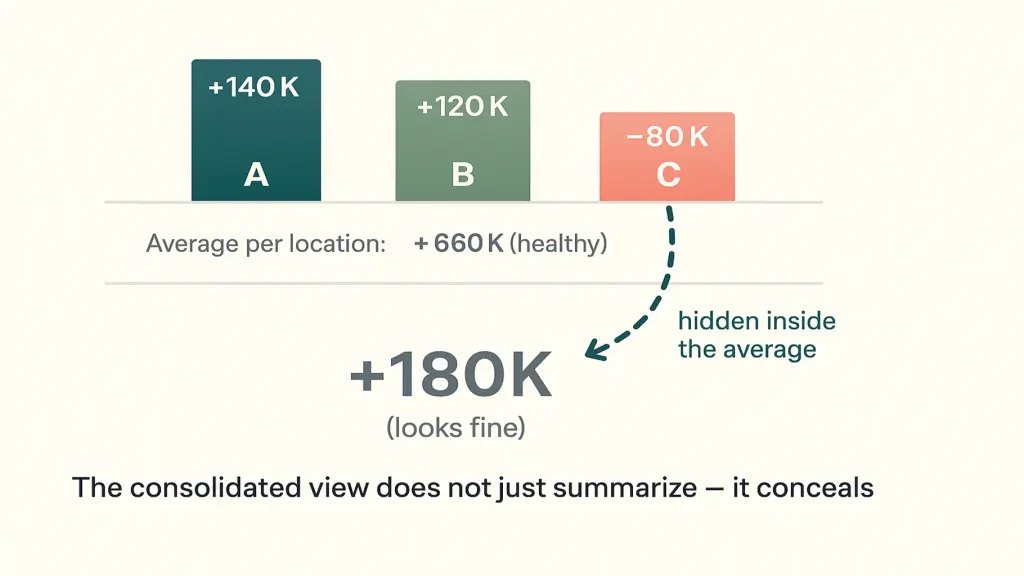
"The monthly report said we made ₴180K profit. Then I built a P&L per location and saw the truth — two shops were making ₴260K. The third was losing ₴80K. And it was the one I drove past every day on the way home."
An owner of a small specialty coffee chain — three locations across two districts, ₴4.8M annual revenue, six employees total — described the conversation with her accountant that started a four-month rebuild.
The chain had grown opportunistically. First location at month 8 of operation, profitable from month 14. Second location at month 20, profitable from month 26. Third location at month 34 — a spot near her home, in a neighborhood she liked, in a building she'd watched come up for lease for months. Eighteen months in, the third location was "doing fine according to the numbers."
The numbers were the consolidated monthly P&L her accountant prepared. Revenue: ₴4.8M annualized. COGS: 32%. Rent: ₴620K. Salaries: ₴1.4M. Other operating: ₴380K. Net: ₴180K. The business looked thin but positive.
And then she built a per-location breakdown for the first time. Location A: +₴140K profit. Location B: +₴120K profit. Location C: −₴80K loss. The third location wasn't "doing fine." It was quietly costing her ₴80K a month and dragging the chain's apparent thin margin down from comfortable to anxious. The reason she hadn't seen it: revenue at location C was healthy. The losses were hidden inside rent (significantly higher than A or B), and salaries (one extra barista because of awkward shift coverage), and supplier waste (a worse delivery schedule meant more spoilage).
This article is the breakdown of how she found it, what she changed, and the framework any multi-location owner can use to do the same.
The Problem with Consolidated P&L for Multi-Location Business
A consolidated P&L tells you whether the chain is profitable. It does not tell you whether each location is profitable. For a single-location business, those are the same question. For a multi-location business, they're completely different — and the consolidated view actively hides location-level problems by averaging them.
- a cash crunch that doesn't match the apparent profitability
- a sudden unexplained drop in the consolidated number when one location has a bad month
- a banker, accountant, or advisor asking "which location is your best one?" and the owner not having an answer
The third trigger is the most common. The question is reasonable. The inability to answer it is the diagnostic.
How to Build a Per-Location P&L (the Practical Version)
The owner of the coffee chain spent two weekends building hers. The structure is straightforward and applies to almost any multi-location small business — coffee shops, gyms, beauty salons, retail, restaurants, dental clinics.
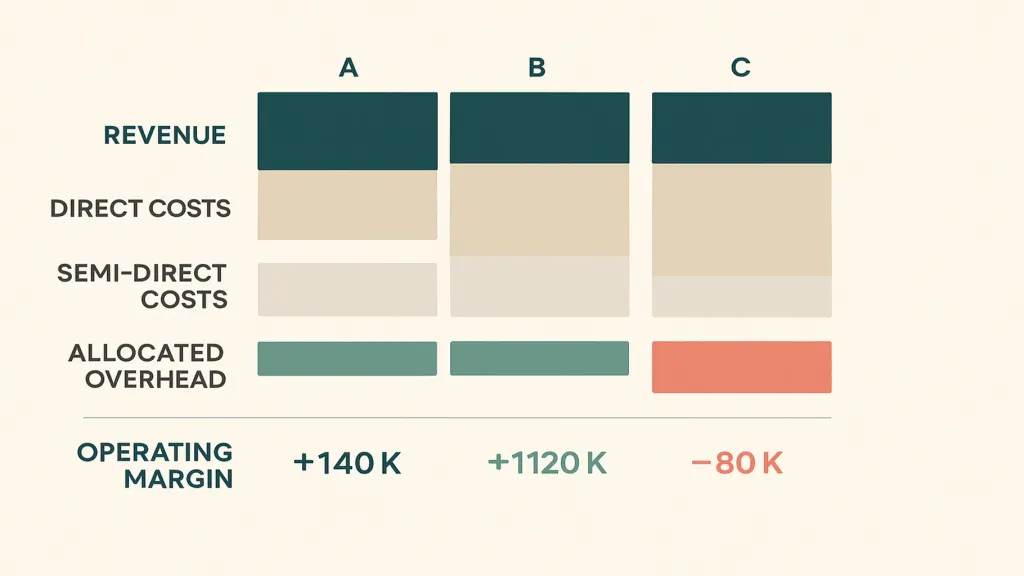
One — revenue per location. Usually easiest, since POS systems already report by location. Pull twelve months. Don't average — keep monthly granularity, because seasonality at one location may not match another.
Two — direct costs per location. COGS (ingredients, products consumed at that location), wages for staff who work only at that location, rent, utilities for that location, supplies and consumables. These should be 60–80% of total costs and are unambiguous.
Three — semi-direct costs allocated. A manager who covers two locations: split by time spent or by revenue share. A supplier delivery that serves two locations: split by volume. These need an allocation rule, but the rule should be transparent and consistent.
Four — shared overhead allocated. Marketing that runs chain-wide, the bookkeeper, the owner's draw, software subscriptions. Allocate by revenue share — it's not perfect, but it's defensible and doesn't require excessive effort.
Five — location-level operating margin. Revenue minus direct minus semi-direct minus allocated overhead. This is the number that tells you whether the location pays for itself plus its share of the chain.
What She Did With the Truth
Three options were on the table. Close location C. Renegotiate location C's costs aggressively. Reposition location C as a different kind of outlet.
She tried the renegotiation first. The landlord agreed to a 15% rent reduction in exchange for a longer lease, because location C had been hard to fill before her and the landlord didn't want to repeat that. The shift schedule was reworked so the extra barista was redistributed across the chain. Supplier deliveries were consolidated to reduce spoilage.
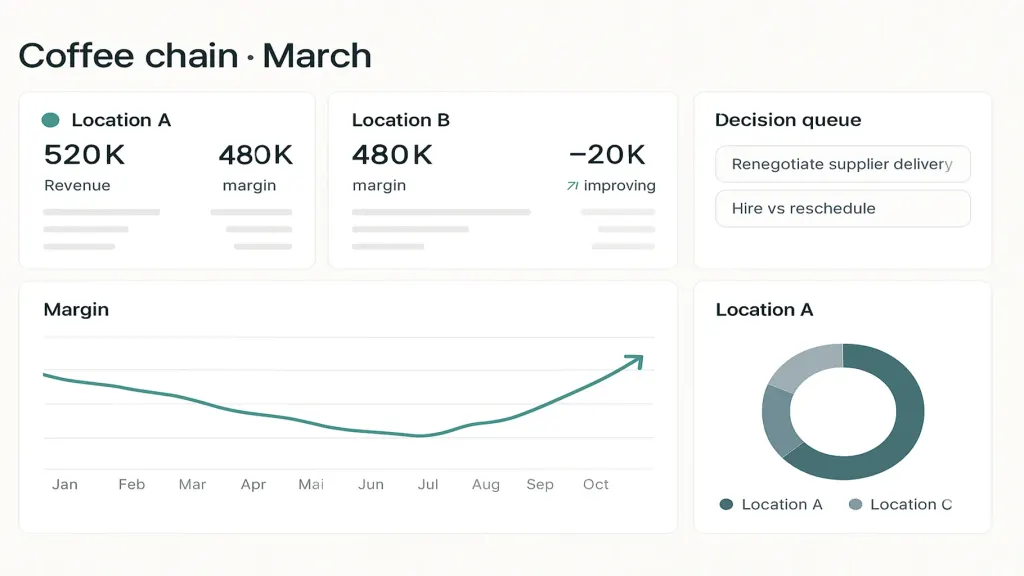
The most expensive thing about location C wasn't the ₴80K loss per month. It was the eighteen months the loss had been invisible. The owner now runs a per-location P&L review every month, with the bookkeeper, in 30 minutes. It would have taken six months of her time to learn the same lesson by accident, and the lesson would have been more expensive.
📌 Want to see whether one of your locations, products, or service lines is quietly losing money? Send your last three months of revenue and cost data — we'll build a one-page diagnostic and walk you through it in 15 minutes. Request your free Finmap diagnostic →
Read also
Share valuable content — become a source of insights





Frequently Asked Questions
How do I allocate shared overhead fairly?

Use revenue share for most categories. It's not perfect, but it's transparent and defensible. Use a different rule only if you have a specific reason (e.g., the bookkeeper actually spends 70% of time on one location — then use time-share for that line).
My POS doesn't separate revenue by location. What do I do?
Most modern POS systems can. If yours can't, either reconfigure it (worth the effort), or estimate based on bank deposit segregation and known sales patterns. Don't skip this — revenue per location is the foundation.
Should I do this before or after I have a third location?
Before. The discipline of building per-location numbers from the start prevents you from making the same mistake the coffee chain owner made — buying a third location based on consolidated optimism.
Can a spreadsheet handle this?
Yes, for 2–5 locations. Above 5, the maintenance becomes painful and the case for a platform becomes clear.
What if one location is new and still ramping?
Track it separately and don't expect break-even in the first 6–12 months. The diagnostic kicks in if the new location hasn't improved in trajectory by month 12.
How often should I review per-location P&L?
Monthly is the cadence. Quarterly is too slow to catch trends. Weekly is too noisy to act on.
Any questions left?
We are ready to answer them.


Finmap support