Table of Contents
Home
/
Blog
/
Where the Profit Hides in a Small Production Business: COGS Isn't What You Think, and WIP Is Eating Your Cash

261

5 min

02.07.2026
Where the Profit Hides in a Small Production Business: COGS Isn't What You Think, and WIP Is Eating Your Cash

Sergiy Shuldik
Financial Expert at Finmap
"On paper we made ₴2.1M last year. In the warehouse, most of it was sitting on shelves as finished goods, half-finished units, and material we'd bought and never turned into anything. The P&L was correct. It just wasn't the whole story."
A founder of a small production business — furniture and interior objects, ₴9M annual revenue, five employees — described the audit that changed how she reads her P&L.
The accountant's monthly P&L showed a healthy year. Revenue: ₴9M. COGS: 48%. Gross margin: 52%. Operating costs: 35%. Net profit: 17%, or ₴1.53M annualized. She had been declaring the business "solidly profitable" for two years.
Then she needed cash. A supplier increased payment terms; a client delayed a large invoice. She looked at her bank account and it held ₴180K. On paper, ₴1.53M had been earned. In reality, ₴180K sat available. The rest was somewhere.
The rest was in inventory. ₴480K in raw materials she'd bought and not yet used. ₴520K in half-finished units on the shop floor (work in progress). ₴680K in finished goods sitting on shelves waiting to sell. Her P&L was technically correct. Her cash situation was structurally different. And her "COGS 48%" number was hiding the mechanics of the whole problem.
Why COGS Alone Is Misleading in Production
In a services business, COGS and cash largely align. Salaries paid, revenue booked, gap is small. In a production business, they can diverge by months or years.
COGS on the P&L is the cost of goods sold — meaning the units that actually left the warehouse and went to a paying customer. Materials she bought this year but hasn't yet used aren't in COGS. Half-finished chairs sitting on the floor aren't in COGS. Finished sofas on the shelf aren't in COGS. All of them consumed cash. None of them show as expense until they're sold.
The result: you can have a "profitable" year while cash disappears into inventory. This is the classic small-manufacturing trap.
The Three Layers of Inventory (and Why Each Is Different)
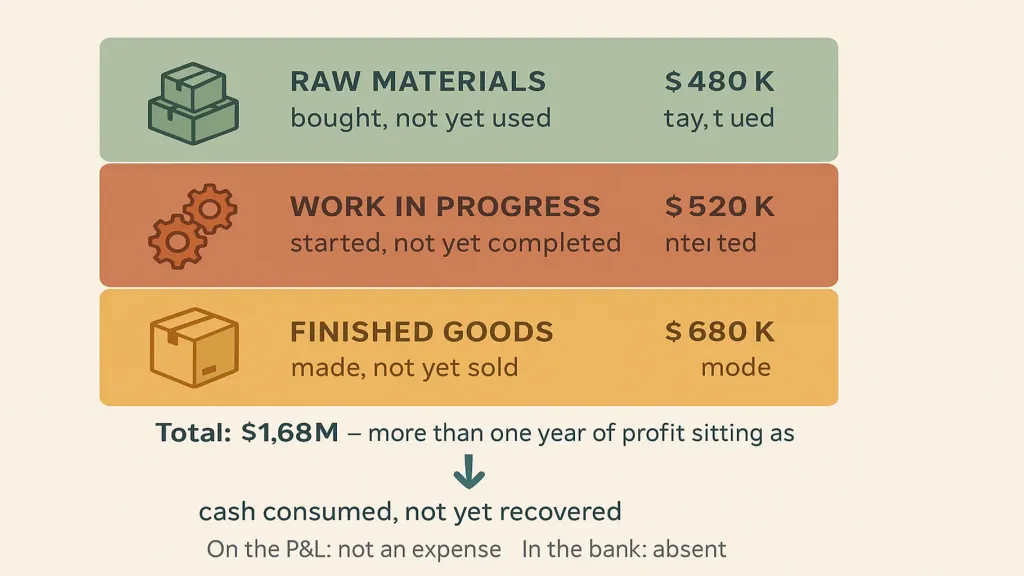
Work in progress (₴520K). Half-finished units on the floor. A chair with the frame done but not upholstered. A sofa waiting for cushions. Each unit has consumed materials and labor, but hasn't yet been sold or even completed. The longer WIP sits, the more cash is trapped.
Finished goods (₴680K). Complete units sitting in the warehouse, waiting for a customer, a delivery slot, a retail season. Cash spent to produce them; cash not yet recovered.
The three layers total ₴1.68M — more than a full year of profit sitting as inventory. The business is "profitable." The owner is short of cash.
The True COGS Picture — What to Actually Watch
The owner rebuilt her cost view with her bookkeeper over two weekends. The framework is a three-part discipline that applies to any small production business.
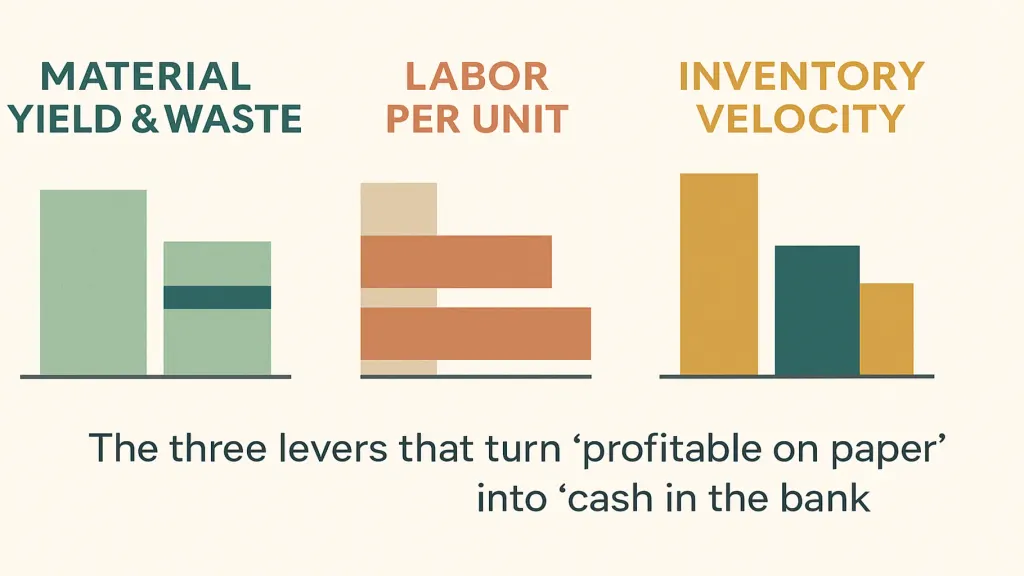
Discipline two — labor per unit. Fully-loaded hourly cost (including PTO, taxes, benefits) × standard hours per unit. Her standard was 4.5 hours; actual was averaging 5.8. That 30% overrun didn't show in COGS aggregate; it showed in labor cost divided by revenue.
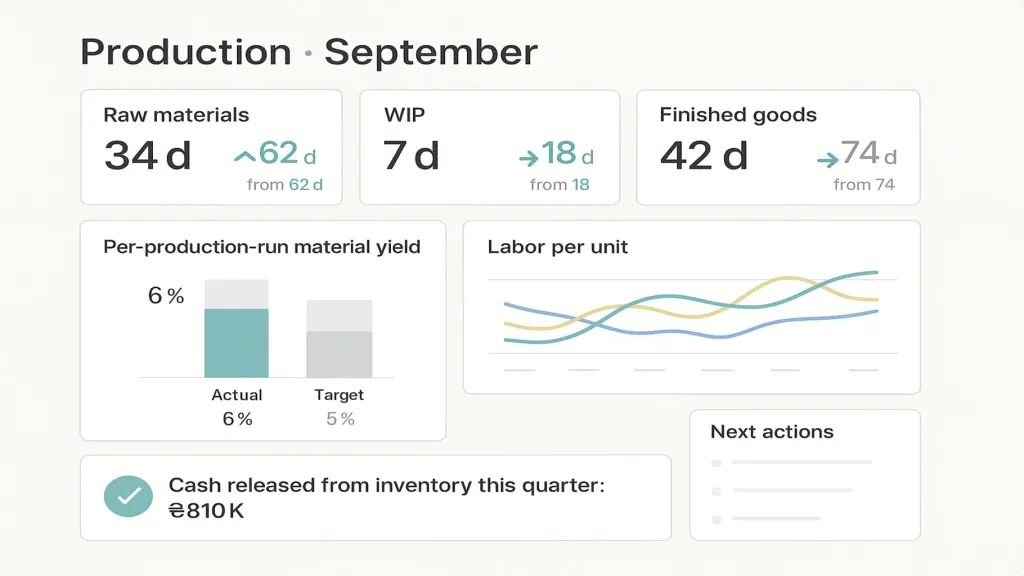
Discipline three — inventory velocity. Days of stock at each layer. Target: raw materials 30 days, WIP 5 days, finished goods 20 days. Actual: 62, 18, 74. Every day beyond target = cash trapped.
What Changed
Once she had the framework, actions became obvious.
- Raw materials. Moved to just-in-time ordering with two key suppliers. Days-of-stock dropped from 62 to 34. Released ₴220K in cash.
- WIP. Batch-size discipline: no starting a new batch until the previous one shipped. WIP days dropped from 18 to 7. Released ₴300K.
- Finished goods. Reworked with sales to align production to actual orders more tightly. FG days dropped from 74 to 42. Released ₴290K.
- Material yield. Waste dropped from 11% to 6% through better cutting patterns and supplier spec discipline. Recovered ~₴180K annualized.
- Labor per unit. Standard revised realistically (5.2 hours), and process tightened on the two worst-performing product lines. Recovered ~₴120K annualized.
Cash freed from inventory reductions: ₴810K in six months. Annualized recurring profit improvement from yield and labor: ~₴300K. The P&L now reads similarly to before — she was already "profitable" on paper — but the bank account and the shop floor tell a completely different story.
The Framework You Can Use
Step 1. Count what's on shelves (raw), on the floor (WIP), on the finished-goods rack. Total in ₴. Step 2. Divide each by daily consumption to get days-of-stock. This is your velocity baseline. Step 3. Set velocity targets. Standard starting point: raw 30d, WIP 5d, finished 20d. Adjust for your business rhythm. Step 4. Track material yield per production run. If you're not measuring waste, you can't reduce it. Step 5. Track actual labor hours per unit vs standard. Overrun trend is the signal. Step 6. Monthly review of the six numbers (three inventory layers + yield + labor + throughput).
📌 Want to see how much cash is actually trapped in your production inventory — and where the yield and labor gaps are? Send us your inventory snapshot and last three months of production runs — we'll build the days-of-stock and true-COGS view in 15 minutes. Request your free Finmap diagnostic →
Read also
- How Finmap Helps Manufacturing Companies Bring Financial Order
- How to Read a P&L Report — And Why Most Owners Miss the Real Signal
Topic foundation: Unit Economics for a Small Business: Do You Actually Make Money on Each Sale?
Share valuable content — become a source of insights



Frequently Asked Questions
Does this apply to service businesses?

Partially. WIP applies (unbilled work in progress). Inventory doesn't unless you hold finished deliverables.
What if my accountant doesn't produce this?
Ask them for inventory value at each layer. If they can't (only give total inventory), it's time for either a better bookkeeper or a system that does the layering automatically.
Spreadsheet or platform?
Spreadsheet works for a single product line and one shop. For multi-SKU with mixed lead times, a platform is dramatically less painful.
Should I get rid of all inventory?
No. Some inventory is strategic (protects against supplier disruption, seasonal demand). The point is to see it clearly and hold only what you actually need.
How is this different from what my ERP shows?
ERPs show levels. This framework shows velocity, yield, and cash impact — which are the decisions layer, not just the data layer.
How often should I review?
Monthly is minimum. Weekly for WIP if you have multiple concurrent batches.
Any questions left?
We are ready to answer them.


Finmap support